Power of Inclusion: enhancing polygenic prediction with admixed individuals
Tanigawa and Kellis. Am J Hum Genet. (2023).
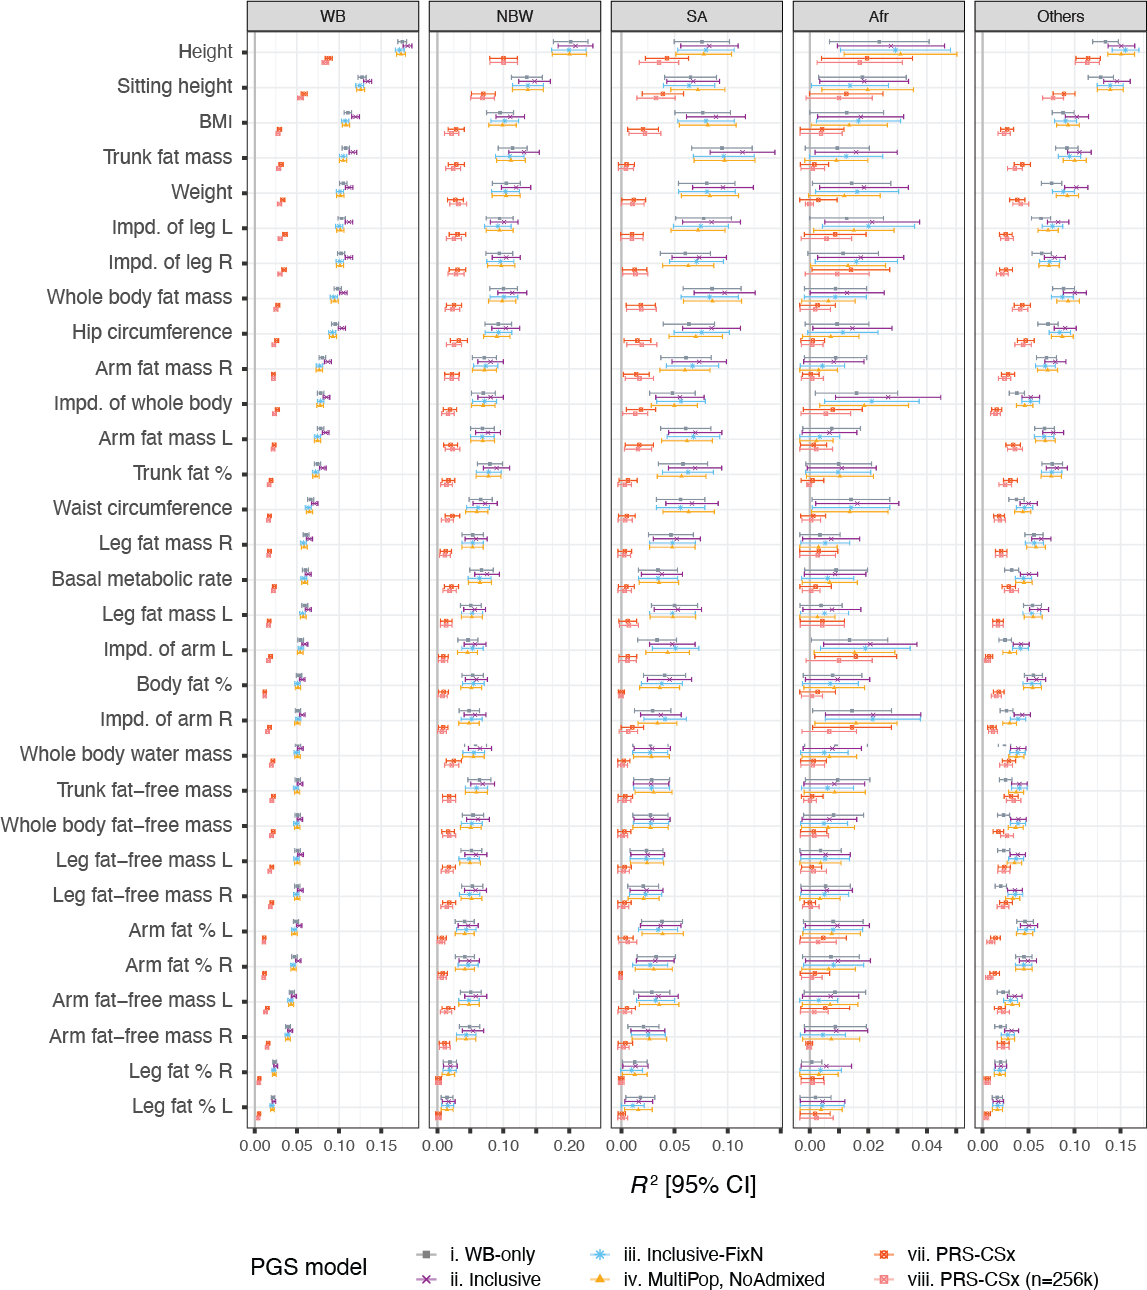
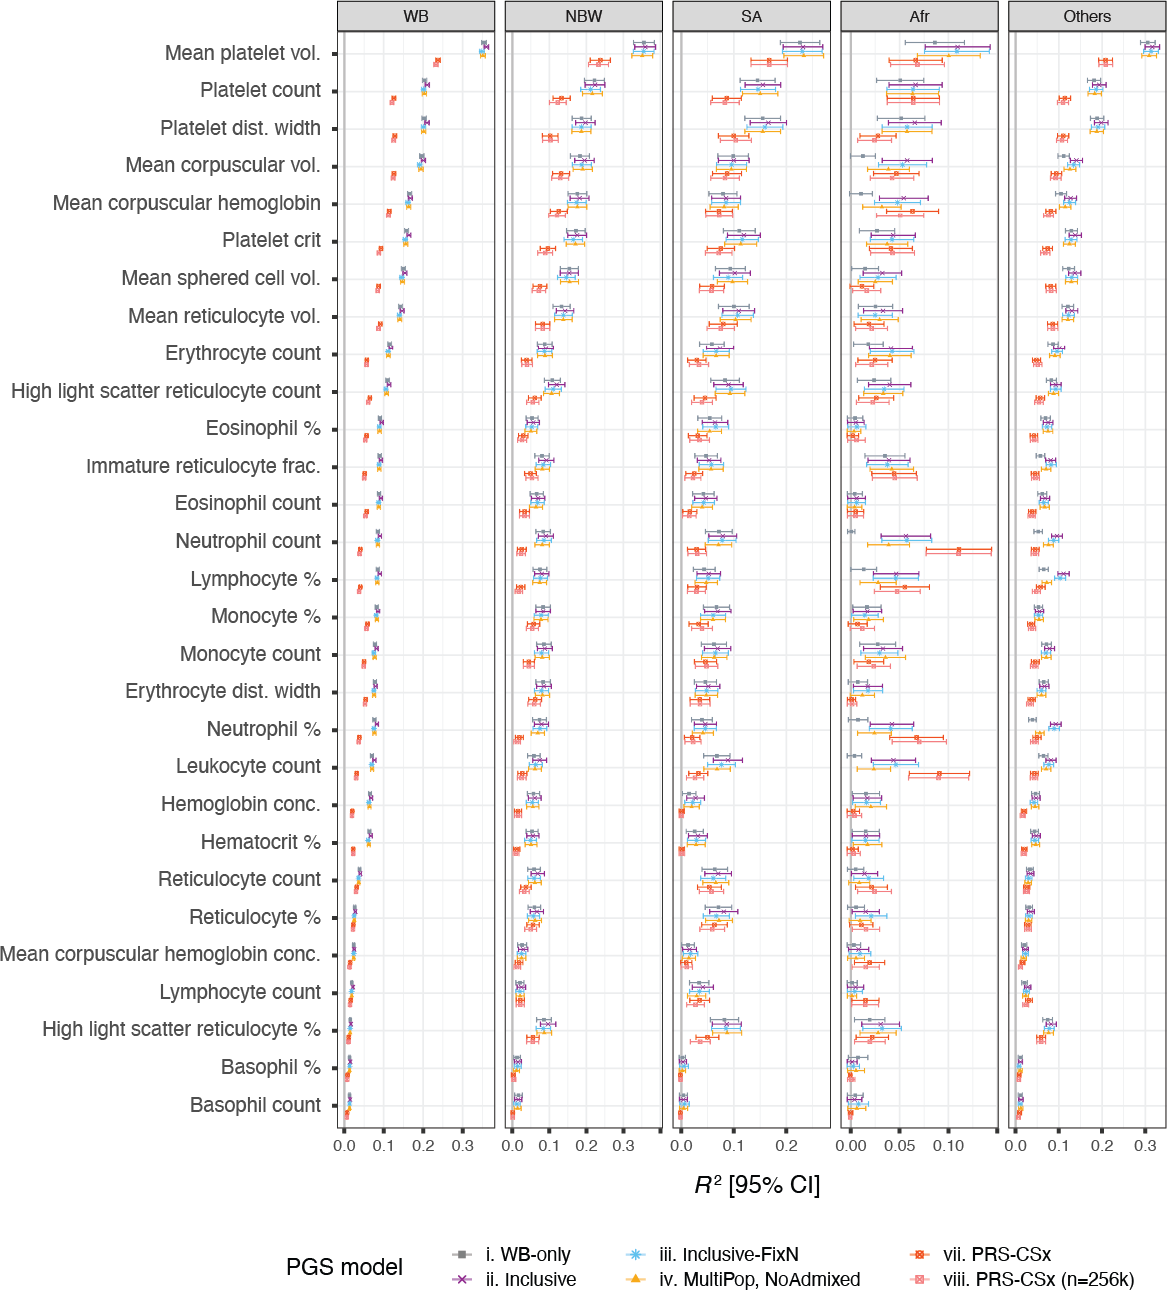
The predictive performance (R2) in white British (WB), non-British white (NBW), South Asian (SA), African (Afr), and the other population group (Others) in UK Biobank are shown for six select models for comparison: (i) WB-only, (ii) inclusive, (iii) inclusive-FixN, (iv) Multi-pop, NoAdmixed, (vii) PRS-CSx, and (viii) PRS-CSx (N=256k). In the browser, we show the results for the inclusive model (model ii).
Predictive performance of inclusive PGS model
| Trait category | Trait | Population | Model | Metric | Predictive Performance | 95% CI | P-value |
|---|---|---|---|---|---|---|---|
| Trait category | Trait | Population | Model | Metric | Predictive Performance | 95% CI | P-value |
|
|
|||||||
| Anthropometry | Sitting height | white British | Covariate-only model | R2 | 0.435 | [0.430, 0.441] | <1.0x10-300 |
| Anthropometry | Sitting height | white British | Genotype-only model | R2 | 0.133 | [0.129, 0.138] | <1.0x10-300 |
| Anthropometry | Sitting height | white British | Full model (covariates and genotypes) | R2 | 0.567 | [0.562, 0.572] | <1.0x10-300 |
| Anthropometry | Sitting height | Non-British white | Covariate-only model | R2 | 0.435 | [0.408, 0.462] | <1.0x10-300 |
| Anthropometry | Sitting height | Non-British white | Genotype-only model | R2 | 0.148 | [0.124, 0.172] | 1.7x10-102 |
| Anthropometry | Sitting height | Non-British white | Full model (covariates and genotypes) | R2 | 0.563 | [0.539, 0.587] | <1.0x10-300 |
| Anthropometry | Sitting height | South Asian | Covariate-only model | R2 | 0.426 | [0.388, 0.464] | 1.2x10-176 |
| Anthropometry | Sitting height | South Asian | Genotype-only model | R2 | 0.068 | [0.043, 0.093] | 5.6x10⁻²⁴ |
| Anthropometry | Sitting height | South Asian | Full model (covariates and genotypes) | R2 | 0.477 | [0.440, 0.513] | 2.3x10-205 |
| Anthropometry | Sitting height | African | Covariate-only model | R2 | 0.356 | [0.312, 0.399] | 2.9x10-115 |
| Anthropometry | Sitting height | African | Genotype-only model | R2 | 0.019 | [0.004, 0.034] | 2.1x10-06 |
| Anthropometry | Sitting height | African | Full model (covariates and genotypes) | R2 | 0.362 | [0.319, 0.405] | 8.3x10-118 |
| Anthropometry | Sitting height | Others | Covariate-only model | R2 | 0.457 | [0.441, 0.473] | <1.0x10-300 |
| Anthropometry | Sitting height | Others | Genotype-only model | R2 | 0.146 | [0.132, 0.160] | 1.0x10-275 |
| Anthropometry | Sitting height | Others | Full model (covariates and genotypes) | R2 | 0.563 | [0.548, 0.577] | <1.0x10-300 |
| Anthropometry | BMI | white British | Covariate-only model | R2 | 0.018 | [0.016, 0.020] | 9.8x10-273 |
| Anthropometry | BMI | white British | Genotype-only model | R2 | 0.119 | [0.114, 0.124] | <1.0x10-300 |
| Anthropometry | BMI | white British | Full model (covariates and genotypes) | R2 | 0.134 | [0.129, 0.139] | <1.0x10-300 |
| Anthropometry | BMI | Non-British white | Covariate-only model | R2 | 0.019 | [0.009, 0.029] | 1.2x10⁻¹³ |
| Anthropometry | BMI | Non-British white | Genotype-only model | R2 | 0.112 | [0.090, 0.133] | 6.4x10-76 |
| Anthropometry | BMI | Non-British white | Full model (covariates and genotypes) | R2 | 0.124 | [0.102, 0.147] | 9.1x10-85 |
| Anthropometry | BMI | South Asian | Covariate-only model | R2 | 0.002 | [-0.003, 0.007] | 6.8x10-02 |
| Anthropometry | BMI | South Asian | Genotype-only model | R2 | 0.089 | [0.062, 0.117] | 2.7x10⁻³¹ |
| Anthropometry | BMI | South Asian | Full model (covariates and genotypes) | R2 | 0.083 | [0.056, 0.110] | 5.1x10⁻²⁹ |
| Anthropometry | BMI | African | Covariate-only model | R2 | 0.002 | [-0.003, 0.007] | 1.4x10-01 |
| Anthropometry | BMI | African | Genotype-only model | R2 | 0.018 | [0.003, 0.032] | 4.3x10-06 |
| Anthropometry | BMI | African | Full model (covariates and genotypes) | R2 | 0.009 | [-0.001, 0.020] | 9.1x10-04 |
| Anthropometry | BMI | Others | Covariate-only model | R2 | 0.050 | [0.040, 0.059] | 3.3x10-90 |
| Anthropometry | BMI | Others | Genotype-only model | R2 | 0.103 | [0.090, 0.115] | 9.1x10-190 |
| Anthropometry | BMI | Others | Full model (covariates and genotypes) | R2 | 0.137 | [0.123, 0.151] | 8.0x10-256 |
| Anthropometry | Weight | white British | Covariate-only model | R2 | 0.218 | [0.213, 0.224] | <1.0x10-300 |
| Anthropometry | Weight | white British | Genotype-only model | R2 | 0.111 | [0.107, 0.116] | <1.0x10-300 |
| Anthropometry | Weight | white British | Full model (covariates and genotypes) | R2 | 0.328 | [0.322, 0.333] | <1.0x10-300 |
| Anthropometry | Weight | Non-British white | Covariate-only model | R2 | 0.235 | [0.208, 0.262] | 4.2x10-169 |
| Anthropometry | Weight | Non-British white | Genotype-only model | R2 | 0.120 | [0.098, 0.143] | 3.6x10-82 |
| Anthropometry | Weight | Non-British white | Full model (covariates and genotypes) | R2 | 0.346 | [0.318, 0.374] | 5.3x10-267 |
| Anthropometry | Weight | South Asian | Covariate-only model | R2 | 0.153 | [0.120, 0.187] | 4.4x10-55 |
| Anthropometry | Weight | South Asian | Genotype-only model | R2 | 0.096 | [0.068, 0.124] | 3.8x10⁻³⁴ |
| Anthropometry | Weight | South Asian | Full model (covariates and genotypes) | R2 | 0.253 | [0.215, 0.291] | 4.5x10-95 |
| Anthropometry | Weight | African | Covariate-only model | R2 | 0.026 | [0.008, 0.043] | 2.4x10-08 |
| Anthropometry | Weight | African | Genotype-only model | R2 | 0.019 | [0.004, 0.034] | 2.1x10-06 |
| Anthropometry | Weight | African | Full model (covariates and genotypes) | R2 | 0.043 | [0.021, 0.065] | 4.3x10⁻¹³ |
| Anthropometry | Weight | Others | Covariate-only model | R2 | 0.263 | [0.246, 0.280] | <1.0x10-300 |
| Anthropometry | Weight | Others | Genotype-only model | R2 | 0.102 | [0.090, 0.115] | 1.2x10-188 |
| Anthropometry | Weight | Others | Full model (covariates and genotypes) | R2 | 0.343 | [0.326, 0.360] | <1.0x10-300 |
| Anthropometry | Body fat % | white British | Covariate-only model | R2 | 0.460 | [0.454, 0.465] | <1.0x10-300 |
| Anthropometry | Body fat % | white British | Genotype-only model | R2 | 0.056 | [0.053, 0.059] | <1.0x10-300 |
| Anthropometry | Body fat % | white British | Full model (covariates and genotypes) | R2 | 0.517 | [0.512, 0.523] | <1.0x10-300 |
| Anthropometry | Body fat % | Non-British white | Covariate-only model | R2 | 0.424 | [0.397, 0.451] | <1.0x10-300 |
| Anthropometry | Body fat % | Non-British white | Genotype-only model | R2 | 0.060 | [0.044, 0.077] | 3.0x10-40 |
| Anthropometry | Body fat % | Non-British white | Full model (covariates and genotypes) | R2 | 0.491 | [0.465, 0.517] | <1.0x10-300 |
| Anthropometry | Body fat % | South Asian | Covariate-only model | R2 | 0.572 | [0.540, 0.605] | 5.5x10-270 |
| Anthropometry | Body fat % | South Asian | Genotype-only model | R2 | 0.046 | [0.025, 0.067] | 1.4x10⁻¹⁶ |
| Anthropometry | Body fat % | South Asian | Full model (covariates and genotypes) | R2 | 0.604 | [0.573, 0.635] | 5.8x10-294 |
| Anthropometry | Body fat % | African | Covariate-only model | R2 | 0.610 | [0.575, 0.644] | 9.3x10-240 |
| Anthropometry | Body fat % | African | Genotype-only model | R2 | 0.010 | [-0.001, 0.021] | 7.4x10-04 |
| Anthropometry | Body fat % | African | Full model (covariates and genotypes) | R2 | 0.594 | [0.559, 0.630] | 3.4x10-230 |
| Anthropometry | Body fat % | Others | Covariate-only model | R2 | 0.431 | [0.414, 0.447] | <1.0x10-300 |
| Anthropometry | Body fat % | Others | Genotype-only model | R2 | 0.059 | [0.049, 0.069] | 7.9x10-106 |
| Anthropometry | Body fat % | Others | Full model (covariates and genotypes) | R2 | 0.476 | [0.460, 0.492] | <1.0x10-300 |
| Anthropometry | Whole body fat mass | white British | Covariate-only model | R2 | 0.068 | [0.065, 0.072] | <1.0x10-300 |
| Anthropometry | Whole body fat mass | white British | Genotype-only model | R2 | 0.105 | [0.100, 0.109] | <1.0x10-300 |
| Anthropometry | Whole body fat mass | white British | Full model (covariates and genotypes) | R2 | 0.172 | [0.167, 0.178] | <1.0x10-300 |
| Anthropometry | Whole body fat mass | Non-British white | Covariate-only model | R2 | 0.044 | [0.030, 0.059] | 9.5x10⁻³⁰ |
| Anthropometry | Whole body fat mass | Non-British white | Genotype-only model | R2 | 0.115 | [0.093, 0.136] | 6.2x10-77 |
| Anthropometry | Whole body fat mass | Non-British white | Full model (covariates and genotypes) | R2 | 0.159 | [0.135, 0.183] | 1.7x10-108 |
| Anthropometry | Whole body fat mass | South Asian | Covariate-only model | R2 | 0.135 | [0.103, 0.168] | 1.1x10-47 |
| Anthropometry | Whole body fat mass | South Asian | Genotype-only model | R2 | 0.098 | [0.069, 0.126] | 3.3x10⁻³⁴ |
| Anthropometry | Whole body fat mass | South Asian | Full model (covariates and genotypes) | R2 | 0.213 | [0.176, 0.249] | 3.4x10-77 |
| Anthropometry | Whole body fat mass | African | Covariate-only model | R2 | 0.205 | [0.164, 0.245] | 1.0x10-59 |
| Anthropometry | Whole body fat mass | African | Genotype-only model | R2 | 0.013 | [0.000, 0.026] | 9.8x10-05 |
| Anthropometry | Whole body fat mass | African | Full model (covariates and genotypes) | R2 | 0.157 | [0.119, 0.194] | 5.7x10-45 |
| Anthropometry | Whole body fat mass | Others | Covariate-only model | R2 | 0.092 | [0.080, 0.104] | 6.3x10-166 |
| Anthropometry | Whole body fat mass | Others | Genotype-only model | R2 | 0.101 | [0.088, 0.113] | 2.4x10-182 |
| Anthropometry | Whole body fat mass | Others | Full model (covariates and genotypes) | R2 | 0.174 | [0.159, 0.189] | <1.0x10-300 |
| Anthropometry | Whole body fat-free mass | white British | Covariate-only model | R2 | 0.709 | [0.706, 0.713] | <1.0x10-300 |
| Anthropometry | Whole body fat-free mass | white British | Genotype-only model | R2 | 0.053 | [0.050, 0.057] | <1.0x10-300 |
| Anthropometry | Whole body fat-free mass | white British | Full model (covariates and genotypes) | R2 | 0.763 | [0.760, 0.766] | <1.0x10-300 |
| Anthropometry | Whole body fat-free mass | Non-British white | Covariate-only model | R2 | 0.706 | [0.688, 0.724] | <1.0x10-300 |
| Anthropometry | Whole body fat-free mass | Non-British white | Genotype-only model | R2 | 0.063 | [0.046, 0.080] | 7.8x10-42 |
| Anthropometry | Whole body fat-free mass | Non-British white | Full model (covariates and genotypes) | R2 | 0.763 | [0.747, 0.778] | <1.0x10-300 |
| Anthropometry | Whole body fat-free mass | South Asian | Covariate-only model | R2 | 0.650 | [0.622, 0.679] | <1.0x10-300 |
| Anthropometry | Whole body fat-free mass | South Asian | Genotype-only model | R2 | 0.030 | [0.013, 0.046] | 4.1x10⁻¹¹ |
| Anthropometry | Whole body fat-free mass | South Asian | Full model (covariates and genotypes) | R2 | 0.695 | [0.669, 0.721] | <1.0x10-300 |
| Anthropometry | Whole body fat-free mass | African | Covariate-only model | R2 | 0.583 | [0.548, 0.619] | 1.6x10-223 |
| Anthropometry | Whole body fat-free mass | African | Genotype-only model | R2 | 0.007 | [-0.002, 0.016] | 4.3x10-03 |
| Anthropometry | Whole body fat-free mass | African | Full model (covariates and genotypes) | R2 | 0.585 | [0.550, 0.621] | 1.0x10-224 |
| Anthropometry | Whole body fat-free mass | Others | Covariate-only model | R2 | 0.711 | [0.700, 0.722] | <1.0x10-300 |
| Anthropometry | Whole body fat-free mass | Others | Genotype-only model | R2 | 0.040 | [0.031, 0.048] | 5.9x10-71 |
| Anthropometry | Whole body fat-free mass | Others | Full model (covariates and genotypes) | R2 | 0.751 | [0.741, 0.760] | <1.0x10-300 |
| Anthropometry | Whole body water mass | white British | Covariate-only model | R2 | 0.706 | [0.702, 0.710] | <1.0x10-300 |
| Anthropometry | Whole body water mass | white British | Genotype-only model | R2 | 0.054 | [0.050, 0.057] | <1.0x10-300 |
| Anthropometry | Whole body water mass | white British | Full model (covariates and genotypes) | R2 | 0.760 | [0.757, 0.763] | <1.0x10-300 |
| Anthropometry | Whole body water mass | Non-British white | Covariate-only model | R2 | 0.700 | [0.682, 0.718] | <1.0x10-300 |
| Anthropometry | Whole body water mass | Non-British white | Genotype-only model | R2 | 0.066 | [0.048, 0.083] | 6.3x10-44 |
| Anthropometry | Whole body water mass | Non-British white | Full model (covariates and genotypes) | R2 | 0.758 | [0.743, 0.773] | <1.0x10-300 |
| Anthropometry | Whole body water mass | South Asian | Covariate-only model | R2 | 0.648 | [0.620, 0.677] | <1.0x10-300 |
| Anthropometry | Whole body water mass | South Asian | Genotype-only model | R2 | 0.030 | [0.013, 0.047] | 3.5x10⁻¹¹ |
| Anthropometry | Whole body water mass | South Asian | Full model (covariates and genotypes) | R2 | 0.693 | [0.667, 0.719] | <1.0x10-300 |
| Anthropometry | Whole body water mass | African | Covariate-only model | R2 | 0.581 | [0.545, 0.617] | 3.2x10-222 |
| Anthropometry | Whole body water mass | African | Genotype-only model | R2 | 0.008 | [-0.002, 0.018] | 2.3x10-03 |
| Anthropometry | Whole body water mass | African | Full model (covariates and genotypes) | R2 | 0.584 | [0.548, 0.619] | 8.9x10-224 |
| Anthropometry | Whole body water mass | Others | Covariate-only model | R2 | 0.709 | [0.699, 0.720] | <1.0x10-300 |
| Anthropometry | Whole body water mass | Others | Genotype-only model | R2 | 0.039 | [0.031, 0.048] | 1.5x10-70 |
| Anthropometry | Whole body water mass | Others | Full model (covariates and genotypes) | R2 | 0.749 | [0.739, 0.758] | <1.0x10-300 |
| Anthropometry | Basal metabolic rate | white British | Covariate-only model | R2 | 0.630 | [0.625, 0.634] | <1.0x10-300 |
| Anthropometry | Basal metabolic rate | white British | Genotype-only model | R2 | 0.063 | [0.059, 0.067] | <1.0x10-300 |
| Anthropometry | Basal metabolic rate | white British | Full model (covariates and genotypes) | R2 | 0.693 | [0.689, 0.697] | <1.0x10-300 |
| Anthropometry | Basal metabolic rate | Non-British white | Covariate-only model | R2 | 0.623 | [0.602, 0.645] | <1.0x10-300 |
| Anthropometry | Basal metabolic rate | Non-British white | Genotype-only model | R2 | 0.076 | [0.058, 0.095] | 5.9x10-51 |
| Anthropometry | Basal metabolic rate | Non-British white | Full model (covariates and genotypes) | R2 | 0.691 | [0.672, 0.710] | <1.0x10-300 |
| Anthropometry | Basal metabolic rate | South Asian | Covariate-only model | R2 | 0.561 | [0.527, 0.594] | 7.8x10-262 |
| Anthropometry | Basal metabolic rate | South Asian | Genotype-only model | R2 | 0.039 | [0.020, 0.058] | 3.3x10⁻¹⁴ |
| Anthropometry | Basal metabolic rate | South Asian | Full model (covariates and genotypes) | R2 | 0.614 | [0.583, 0.645] | 1.1x10-302 |
| Anthropometry | Basal metabolic rate | African | Covariate-only model | R2 | 0.466 | [0.425, 0.507] | 8.4x10-161 |
| Anthropometry | Basal metabolic rate | African | Genotype-only model | R2 | 0.009 | [-0.002, 0.019] | 1.3x10-03 |
| Anthropometry | Basal metabolic rate | African | Full model (covariates and genotypes) | R2 | 0.470 | [0.429, 0.511] | 9.8x10-163 |
| Anthropometry | Basal metabolic rate | Others | Covariate-only model | R2 | 0.636 | [0.623, 0.648] | <1.0x10-300 |
| Anthropometry | Basal metabolic rate | Others | Genotype-only model | R2 | 0.051 | [0.042, 0.060] | 2.0x10-91 |
| Anthropometry | Basal metabolic rate | Others | Full model (covariates and genotypes) | R2 | 0.682 | [0.671, 0.694] | <1.0x10-300 |
| Anthropometry | Impd. of whole body | white British | Covariate-only model | R2 | 0.439 | [0.433, 0.444] | <1.0x10-300 |
| Anthropometry | Impd. of whole body | white British | Genotype-only model | R2 | 0.085 | [0.081, 0.089] | <1.0x10-300 |
| Anthropometry | Impd. of whole body | white British | Full model (covariates and genotypes) | R2 | 0.522 | [0.517, 0.528] | <1.0x10-300 |
| Anthropometry | Impd. of whole body | Non-British white | Covariate-only model | R2 | 0.426 | [0.399, 0.453] | <1.0x10-300 |
| Anthropometry | Impd. of whole body | Non-British white | Genotype-only model | R2 | 0.082 | [0.063, 0.101] | 1.3x10-54 |
| Anthropometry | Impd. of whole body | Non-British white | Full model (covariates and genotypes) | R2 | 0.507 | [0.481, 0.532] | <1.0x10-300 |
| Anthropometry | Impd. of whole body | South Asian | Covariate-only model | R2 | 0.360 | [0.321, 0.399] | 8.4x10-143 |
| Anthropometry | Impd. of whole body | South Asian | Genotype-only model | R2 | 0.056 | [0.033, 0.078] | 6.9x10⁻²⁰ |
| Anthropometry | Impd. of whole body | South Asian | Full model (covariates and genotypes) | R2 | 0.417 | [0.379, 0.456] | 1.0x10-172 |
| Anthropometry | Impd. of whole body | African | Covariate-only model | R2 | 0.254 | [0.212, 0.297] | 3.1x10-76 |
| Anthropometry | Impd. of whole body | African | Genotype-only model | R2 | 0.027 | [0.009, 0.045] | 1.7x10-08 |
| Anthropometry | Impd. of whole body | African | Full model (covariates and genotypes) | R2 | 0.279 | [0.236, 0.322] | 8.0x10-85 |
| Anthropometry | Impd. of whole body | Others | Covariate-only model | R2 | 0.441 | [0.425, 0.458] | <1.0x10-300 |
| Anthropometry | Impd. of whole body | Others | Genotype-only model | R2 | 0.053 | [0.043, 0.063] | 9.6x10-95 |
| Anthropometry | Impd. of whole body | Others | Full model (covariates and genotypes) | R2 | 0.492 | [0.477, 0.508] | <1.0x10-300 |
| Anthropometry | Impd. of leg R | white British | Covariate-only model | R2 | 0.193 | [0.188, 0.198] | <1.0x10-300 |
| Anthropometry | Impd. of leg R | white British | Genotype-only model | R2 | 0.111 | [0.107, 0.116] | <1.0x10-300 |
| Anthropometry | Impd. of leg R | white British | Full model (covariates and genotypes) | R2 | 0.303 | [0.297, 0.309] | <1.0x10-300 |
| Anthropometry | Impd. of leg R | Non-British white | Covariate-only model | R2 | 0.189 | [0.164, 0.215] | 3.3x10-131 |
| Anthropometry | Impd. of leg R | Non-British white | Genotype-only model | R2 | 0.105 | [0.084, 0.127] | 1.2x10-70 |
| Anthropometry | Impd. of leg R | Non-British white | Full model (covariates and genotypes) | R2 | 0.297 | [0.269, 0.325] | 3.5x10-219 |
| Anthropometry | Impd. of leg R | South Asian | Covariate-only model | R2 | 0.113 | [0.083, 0.143] | 1.1x10-39 |
| Anthropometry | Impd. of leg R | South Asian | Genotype-only model | R2 | 0.074 | [0.048, 0.099] | 4.9x10⁻²⁶ |
| Anthropometry | Impd. of leg R | South Asian | Full model (covariates and genotypes) | R2 | 0.186 | [0.150, 0.221] | 8.4x10-67 |
| Anthropometry | Impd. of leg R | African | Covariate-only model | R2 | 0.056 | [0.031, 0.081] | 3.1x10⁻¹⁶ |
| Anthropometry | Impd. of leg R | African | Genotype-only model | R2 | 0.018 | [0.003, 0.032] | 5.3x10-06 |
| Anthropometry | Impd. of leg R | African | Full model (covariates and genotypes) | R2 | 0.073 | [0.045, 0.101] | 6.2x10⁻²¹ |
| Anthropometry | Impd. of leg R | Others | Covariate-only model | R2 | 0.212 | [0.197, 0.228] | <1.0x10-300 |
| Anthropometry | Impd. of leg R | Others | Genotype-only model | R2 | 0.079 | [0.068, 0.090] | 3.8x10-142 |
| Anthropometry | Impd. of leg R | Others | Full model (covariates and genotypes) | R2 | 0.282 | [0.265, 0.299] | <1.0x10-300 |
| Anthropometry | Impd. of leg L | white British | Covariate-only model | R2 | 0.181 | [0.176, 0.186] | <1.0x10-300 |
| Anthropometry | Impd. of leg L | white British | Genotype-only model | R2 | 0.111 | [0.107, 0.116] | <1.0x10-300 |
| Anthropometry | Impd. of leg L | white British | Full model (covariates and genotypes) | R2 | 0.291 | [0.286, 0.297] | <1.0x10-300 |
| Anthropometry | Impd. of leg L | Non-British white | Covariate-only model | R2 | 0.182 | [0.156, 0.207] | 1.4x10-125 |
| Anthropometry | Impd. of leg L | Non-British white | Genotype-only model | R2 | 0.102 | [0.081, 0.123] | 1.8x10-68 |
| Anthropometry | Impd. of leg L | Non-British white | Full model (covariates and genotypes) | R2 | 0.286 | [0.259, 0.314] | 6.3x10-210 |
| Anthropometry | Impd. of leg L | South Asian | Covariate-only model | R2 | 0.117 | [0.086, 0.147] | 4.2x10-41 |
| Anthropometry | Impd. of leg L | South Asian | Genotype-only model | R2 | 0.085 | [0.058, 0.112] | 4.7x10⁻³⁰ |
| Anthropometry | Impd. of leg L | South Asian | Full model (covariates and genotypes) | R2 | 0.200 | [0.163, 0.236] | 2.7x10-72 |
| Anthropometry | Impd. of leg L | African | Covariate-only model | R2 | 0.050 | [0.026, 0.074] | 1.0x10⁻¹⁴ |
| Anthropometry | Impd. of leg L | African | Genotype-only model | R2 | 0.022 | [0.005, 0.038] | 4.7x10-07 |
| Anthropometry | Impd. of leg L | African | Full model (covariates and genotypes) | R2 | 0.072 | [0.044, 0.100] | 1.1x10⁻²⁰ |
| Anthropometry | Impd. of leg L | Others | Covariate-only model | R2 | 0.204 | [0.188, 0.220] | <1.0x10-300 |
| Anthropometry | Impd. of leg L | Others | Genotype-only model | R2 | 0.083 | [0.071, 0.094] | 5.9x10-149 |
| Anthropometry | Impd. of leg L | Others | Full model (covariates and genotypes) | R2 | 0.278 | [0.262, 0.295] | <1.0x10-300 |
| Anthropometry | Impd. of arm R | white British | Covariate-only model | R2 | 0.522 | [0.517, 0.527] | <1.0x10-300 |
| Anthropometry | Impd. of arm R | white British | Genotype-only model | R2 | 0.056 | [0.053, 0.059] | <1.0x10-300 |
| Anthropometry | Impd. of arm R | white British | Full model (covariates and genotypes) | R2 | 0.577 | [0.572, 0.582] | <1.0x10-300 |
| Anthropometry | Impd. of arm R | Non-British white | Covariate-only model | R2 | 0.531 | [0.506, 0.556] | <1.0x10-300 |
| Anthropometry | Impd. of arm R | Non-British white | Genotype-only model | R2 | 0.058 | [0.042, 0.075] | 6.2x10-39 |
| Anthropometry | Impd. of arm R | Non-British white | Full model (covariates and genotypes) | R2 | 0.586 | [0.563, 0.609] | <1.0x10-300 |
| Anthropometry | Impd. of arm R | South Asian | Covariate-only model | R2 | 0.480 | [0.444, 0.517] | 7.5x10-209 |
| Anthropometry | Impd. of arm R | South Asian | Genotype-only model | R2 | 0.038 | [0.019, 0.057] | 7.0x10⁻¹⁴ |
| Anthropometry | Impd. of arm R | South Asian | Full model (covariates and genotypes) | R2 | 0.522 | [0.487, 0.557] | 2.4x10-235 |
| Anthropometry | Impd. of arm R | African | Covariate-only model | R2 | 0.352 | [0.308, 0.395] | 1.3x10-111 |
| Anthropometry | Impd. of arm R | African | Genotype-only model | R2 | 0.022 | [0.006, 0.038] | 3.9x10-07 |
| Anthropometry | Impd. of arm R | African | Full model (covariates and genotypes) | R2 | 0.369 | [0.326, 0.412] | 2.1x10-118 |
| Anthropometry | Impd. of arm R | Others | Covariate-only model | R2 | 0.535 | [0.520, 0.550] | <1.0x10-300 |
| Anthropometry | Impd. of arm R | Others | Genotype-only model | R2 | 0.044 | [0.035, 0.053] | 3.0x10-78 |
| Anthropometry | Impd. of arm R | Others | Full model (covariates and genotypes) | R2 | 0.576 | [0.562, 0.590] | <1.0x10-300 |
| Anthropometry | Impd. of arm L | white British | Covariate-only model | R2 | 0.529 | [0.523, 0.534] | <1.0x10-300 |
| Anthropometry | Impd. of arm L | white British | Genotype-only model | R2 | 0.059 | [0.056, 0.063] | <1.0x10-300 |
| Anthropometry | Impd. of arm L | white British | Full model (covariates and genotypes) | R2 | 0.587 | [0.582, 0.591] | <1.0x10-300 |
| Anthropometry | Impd. of arm L | Non-British white | Covariate-only model | R2 | 0.528 | [0.503, 0.553] | <1.0x10-300 |
| Anthropometry | Impd. of arm L | Non-British white | Genotype-only model | R2 | 0.058 | [0.042, 0.075] | 5.3x10-39 |
| Anthropometry | Impd. of arm L | Non-British white | Full model (covariates and genotypes) | R2 | 0.582 | [0.559, 0.605] | <1.0x10-300 |
| Anthropometry | Impd. of arm L | South Asian | Covariate-only model | R2 | 0.474 | [0.437, 0.510] | 1.1x10-204 |
| Anthropometry | Impd. of arm L | South Asian | Genotype-only model | R2 | 0.049 | [0.027, 0.070] | 1.7x10⁻¹⁷ |
| Anthropometry | Impd. of arm L | South Asian | Full model (covariates and genotypes) | R2 | 0.521 | [0.486, 0.556] | 1.3x10-234 |
| Anthropometry | Impd. of arm L | African | Covariate-only model | R2 | 0.373 | [0.330, 0.416] | 2.5x10-120 |
| Anthropometry | Impd. of arm L | African | Genotype-only model | R2 | 0.021 | [0.005, 0.037] | 7.1x10-07 |
| Anthropometry | Impd. of arm L | African | Full model (covariates and genotypes) | R2 | 0.390 | [0.347, 0.433] | 3.7x10-127 |
| Anthropometry | Impd. of arm L | Others | Covariate-only model | R2 | 0.533 | [0.518, 0.548] | <1.0x10-300 |
| Anthropometry | Impd. of arm L | Others | Genotype-only model | R2 | 0.043 | [0.034, 0.051] | 3.7x10-76 |
| Anthropometry | Impd. of arm L | Others | Full model (covariates and genotypes) | R2 | 0.575 | [0.561, 0.589] | <1.0x10-300 |
| Anthropometry | Leg fat % R | white British | Covariate-only model | R2 | 0.740 | [0.737, 0.744] | <1.0x10-300 |
| Anthropometry | Leg fat % R | white British | Genotype-only model | R2 | 0.025 | [0.022, 0.027] | <1.0x10-300 |
| Anthropometry | Leg fat % R | white British | Full model (covariates and genotypes) | R2 | 0.767 | [0.763, 0.770] | <1.0x10-300 |
| Anthropometry | Leg fat % R | Non-British white | Covariate-only model | R2 | 0.722 | [0.704, 0.739] | <1.0x10-300 |
| Anthropometry | Leg fat % R | Non-British white | Genotype-only model | R2 | 0.021 | [0.011, 0.032] | 6.7x10⁻¹⁵ |
| Anthropometry | Leg fat % R | Non-British white | Full model (covariates and genotypes) | R2 | 0.753 | [0.737, 0.768] | <1.0x10-300 |
| Anthropometry | Leg fat % R | South Asian | Covariate-only model | R2 | 0.789 | [0.770, 0.808] | <1.0x10-300 |
| Anthropometry | Leg fat % R | South Asian | Genotype-only model | R2 | 0.014 | [0.002, 0.026] | 5.8x10-06 |
| Anthropometry | Leg fat % R | South Asian | Full model (covariates and genotypes) | R2 | 0.800 | [0.782, 0.818] | <1.0x10-300 |
| Anthropometry | Leg fat % R | African | Covariate-only model | R2 | 0.800 | [0.780, 0.820] | <1.0x10-300 |
| Anthropometry | Leg fat % R | African | Genotype-only model | R2 | 0.006 | [-0.003, 0.014] | 8.6x10-03 |
| Anthropometry | Leg fat % R | African | Full model (covariates and genotypes) | R2 | 0.795 | [0.774, 0.815] | <1.0x10-300 |
| Anthropometry | Leg fat % R | Others | Covariate-only model | R2 | 0.728 | [0.718, 0.738] | <1.0x10-300 |
| Anthropometry | Leg fat % R | Others | Genotype-only model | R2 | 0.021 | [0.015, 0.027] | 1.1x10-37 |
| Anthropometry | Leg fat % R | Others | Full model (covariates and genotypes) | R2 | 0.746 | [0.736, 0.755] | <1.0x10-300 |
| Anthropometry | Leg fat mass R | white British | Covariate-only model | R2 | 0.321 | [0.315, 0.327] | <1.0x10-300 |
| Anthropometry | Leg fat mass R | white British | Genotype-only model | R2 | 0.065 | [0.061, 0.068] | <1.0x10-300 |
| Anthropometry | Leg fat mass R | white British | Full model (covariates and genotypes) | R2 | 0.386 | [0.380, 0.392] | <1.0x10-300 |
| Anthropometry | Leg fat mass R | Non-British white | Covariate-only model | R2 | 0.290 | [0.262, 0.317] | 1.3x10-212 |
| Anthropometry | Leg fat mass R | Non-British white | Genotype-only model | R2 | 0.060 | [0.043, 0.077] | 5.7x10-40 |
| Anthropometry | Leg fat mass R | Non-British white | Full model (covariates and genotypes) | R2 | 0.360 | [0.332, 0.388] | 1.3x10-276 |
| Anthropometry | Leg fat mass R | South Asian | Covariate-only model | R2 | 0.430 | [0.392, 0.468] | 8.8x10-180 |
| Anthropometry | Leg fat mass R | South Asian | Genotype-only model | R2 | 0.053 | [0.031, 0.075] | 7.1x10⁻¹⁹ |
| Anthropometry | Leg fat mass R | South Asian | Full model (covariates and genotypes) | R2 | 0.469 | [0.432, 0.505] | 1.1x10-201 |
| Anthropometry | Leg fat mass R | African | Covariate-only model | R2 | 0.444 | [0.402, 0.485] | 1.7x10-150 |
| Anthropometry | Leg fat mass R | African | Genotype-only model | R2 | 0.008 | [-0.002, 0.017] | 2.9x10-03 |
| Anthropometry | Leg fat mass R | African | Full model (covariates and genotypes) | R2 | 0.418 | [0.376, 0.460] | 4.2x10-139 |
| Anthropometry | Leg fat mass R | Others | Covariate-only model | R2 | 0.322 | [0.305, 0.339] | <1.0x10-300 |
| Anthropometry | Leg fat mass R | Others | Genotype-only model | R2 | 0.064 | [0.054, 0.075] | 1.5x10-115 |
| Anthropometry | Leg fat mass R | Others | Full model (covariates and genotypes) | R2 | 0.371 | [0.354, 0.388] | <1.0x10-300 |
| Anthropometry | Leg fat-free mass R | white British | Covariate-only model | R2 | 0.649 | [0.644, 0.653] | <1.0x10-300 |
| Anthropometry | Leg fat-free mass R | white British | Genotype-only model | R2 | 0.054 | [0.050, 0.057] | <1.0x10-300 |
| Anthropometry | Leg fat-free mass R | white British | Full model (covariates and genotypes) | R2 | 0.702 | [0.699, 0.706] | <1.0x10-300 |
| Anthropometry | Leg fat-free mass R | Non-British white | Covariate-only model | R2 | 0.654 | [0.633, 0.674] | <1.0x10-300 |
| Anthropometry | Leg fat-free mass R | Non-British white | Genotype-only model | R2 | 0.059 | [0.042, 0.076] | 2.1x10-39 |
| Anthropometry | Leg fat-free mass R | Non-British white | Full model (covariates and genotypes) | R2 | 0.710 | [0.692, 0.728] | <1.0x10-300 |
| Anthropometry | Leg fat-free mass R | South Asian | Covariate-only model | R2 | 0.609 | [0.578, 0.639] | 3.5x10-298 |
| Anthropometry | Leg fat-free mass R | South Asian | Genotype-only model | R2 | 0.024 | [0.009, 0.040] | 2.0x10-09 |
| Anthropometry | Leg fat-free mass R | South Asian | Full model (covariates and genotypes) | R2 | 0.646 | [0.617, 0.675] | <1.0x10-300 |
| Anthropometry | Leg fat-free mass R | African | Covariate-only model | R2 | 0.521 | [0.482, 0.560] | 3.7x10-188 |
| Anthropometry | Leg fat-free mass R | African | Genotype-only model | R2 | 0.006 | [-0.003, 0.015] | 7.7x10-03 |
| Anthropometry | Leg fat-free mass R | African | Full model (covariates and genotypes) | R2 | 0.518 | [0.479, 0.557] | 1.1x10-186 |
| Anthropometry | Leg fat-free mass R | Others | Covariate-only model | R2 | 0.667 | [0.655, 0.679] | <1.0x10-300 |
| Anthropometry | Leg fat-free mass R | Others | Genotype-only model | R2 | 0.036 | [0.028, 0.044] | 3.0x10-64 |
| Anthropometry | Leg fat-free mass R | Others | Full model (covariates and genotypes) | R2 | 0.704 | [0.693, 0.715] | <1.0x10-300 |
| Anthropometry | Leg fat % L | white British | Covariate-only model | R2 | 0.763 | [0.760, 0.766] | <1.0x10-300 |
| Anthropometry | Leg fat % L | white British | Genotype-only model | R2 | 0.023 | [0.020, 0.025] | <1.0x10-300 |
| Anthropometry | Leg fat % L | white British | Full model (covariates and genotypes) | R2 | 0.787 | [0.784, 0.790] | <1.0x10-300 |
| Anthropometry | Leg fat % L | Non-British white | Covariate-only model | R2 | 0.746 | [0.730, 0.762] | <1.0x10-300 |
| Anthropometry | Leg fat % L | Non-British white | Genotype-only model | R2 | 0.018 | [0.009, 0.028] | 3.7x10⁻¹³ |
| Anthropometry | Leg fat % L | Non-British white | Full model (covariates and genotypes) | R2 | 0.774 | [0.760, 0.789] | <1.0x10-300 |
| Anthropometry | Leg fat % L | South Asian | Covariate-only model | R2 | 0.822 | [0.806, 0.838] | <1.0x10-300 |
| Anthropometry | Leg fat % L | South Asian | Genotype-only model | R2 | 0.017 | [0.004, 0.030] | 5.3x10-07 |
| Anthropometry | Leg fat % L | South Asian | Full model (covariates and genotypes) | R2 | 0.835 | [0.819, 0.850] | <1.0x10-300 |
| Anthropometry | Leg fat % L | African | Covariate-only model | R2 | 0.814 | [0.795, 0.833] | <1.0x10-300 |
| Anthropometry | Leg fat % L | African | Genotype-only model | R2 | 0.005 | [-0.003, 0.012] | 2.0x10-02 |
| Anthropometry | Leg fat % L | African | Full model (covariates and genotypes) | R2 | 0.811 | [0.792, 0.830] | <1.0x10-300 |
| Anthropometry | Leg fat % L | Others | Covariate-only model | R2 | 0.753 | [0.744, 0.762] | <1.0x10-300 |
| Anthropometry | Leg fat % L | Others | Genotype-only model | R2 | 0.018 | [0.012, 0.024] | 1.2x10⁻³² |
| Anthropometry | Leg fat % L | Others | Full model (covariates and genotypes) | R2 | 0.770 | [0.761, 0.779] | <1.0x10-300 |
| Anthropometry | Leg fat mass L | white British | Covariate-only model | R2 | 0.334 | [0.328, 0.339] | <1.0x10-300 |
| Anthropometry | Leg fat mass L | white British | Genotype-only model | R2 | 0.063 | [0.060, 0.067] | <1.0x10-300 |
| Anthropometry | Leg fat mass L | white British | Full model (covariates and genotypes) | R2 | 0.397 | [0.392, 0.403] | <1.0x10-300 |
| Anthropometry | Leg fat mass L | Non-British white | Covariate-only model | R2 | 0.304 | [0.276, 0.332] | 7.3x10-225 |
| Anthropometry | Leg fat mass L | Non-British white | Genotype-only model | R2 | 0.058 | [0.041, 0.074] | 1.3x10-38 |
| Anthropometry | Leg fat mass L | Non-British white | Full model (covariates and genotypes) | R2 | 0.372 | [0.345, 0.400] | 5.6x10-289 |
| Anthropometry | Leg fat mass L | South Asian | Covariate-only model | R2 | 0.456 | [0.418, 0.493] | 4.0x10-194 |
| Anthropometry | Leg fat mass L | South Asian | Genotype-only model | R2 | 0.054 | [0.031, 0.076] | 3.1x10⁻¹⁹ |
| Anthropometry | Leg fat mass L | South Asian | Full model (covariates and genotypes) | R2 | 0.493 | [0.456, 0.529] | 2.8x10-216 |
| Anthropometry | Leg fat mass L | African | Covariate-only model | R2 | 0.451 | [0.409, 0.492] | 1.3x10-153 |
| Anthropometry | Leg fat mass L | African | Genotype-only model | R2 | 0.008 | [-0.002, 0.018] | 2.5x10-03 |
| Anthropometry | Leg fat mass L | African | Full model (covariates and genotypes) | R2 | 0.428 | [0.386, 0.470] | 1.7x10-143 |
| Anthropometry | Leg fat mass L | Others | Covariate-only model | R2 | 0.334 | [0.317, 0.351] | <1.0x10-300 |
| Anthropometry | Leg fat mass L | Others | Genotype-only model | R2 | 0.062 | [0.052, 0.072] | 3.9x10-111 |
| Anthropometry | Leg fat mass L | Others | Full model (covariates and genotypes) | R2 | 0.382 | [0.365, 0.399] | <1.0x10-300 |
| Anthropometry | Leg fat-free mass L | white British | Covariate-only model | R2 | 0.643 | [0.639, 0.648] | <1.0x10-300 |
| Anthropometry | Leg fat-free mass L | white British | Genotype-only model | R2 | 0.054 | [0.051, 0.057] | <1.0x10-300 |
| Anthropometry | Leg fat-free mass L | white British | Full model (covariates and genotypes) | R2 | 0.697 | [0.693, 0.701] | <1.0x10-300 |
| Anthropometry | Leg fat-free mass L | Non-British white | Covariate-only model | R2 | 0.644 | [0.623, 0.664] | <1.0x10-300 |
| Anthropometry | Leg fat-free mass L | Non-British white | Genotype-only model | R2 | 0.060 | [0.043, 0.076] | 7.7x10-40 |
| Anthropometry | Leg fat-free mass L | Non-British white | Full model (covariates and genotypes) | R2 | 0.701 | [0.683, 0.719] | <1.0x10-300 |
| Anthropometry | Leg fat-free mass L | South Asian | Covariate-only model | R2 | 0.615 | [0.584, 0.646] | 2.3x10-303 |
| Anthropometry | Leg fat-free mass L | South Asian | Genotype-only model | R2 | 0.026 | [0.010, 0.041] | 8.4x10⁻¹⁰ |
| Anthropometry | Leg fat-free mass L | South Asian | Full model (covariates and genotypes) | R2 | 0.656 | [0.627, 0.684] | <1.0x10-300 |
| Anthropometry | Leg fat-free mass L | African | Covariate-only model | R2 | 0.506 | [0.466, 0.545] | 2.7x10-180 |
| Anthropometry | Leg fat-free mass L | African | Genotype-only model | R2 | 0.006 | [-0.003, 0.014] | 1.0x10-02 |
| Anthropometry | Leg fat-free mass L | African | Full model (covariates and genotypes) | R2 | 0.504 | [0.465, 0.544] | 1.2x10-179 |
| Anthropometry | Leg fat-free mass L | Others | Covariate-only model | R2 | 0.660 | [0.648, 0.672] | <1.0x10-300 |
| Anthropometry | Leg fat-free mass L | Others | Genotype-only model | R2 | 0.039 | [0.031, 0.047] | 1.1x10-69 |
| Anthropometry | Leg fat-free mass L | Others | Full model (covariates and genotypes) | R2 | 0.699 | [0.688, 0.710] | <1.0x10-300 |
| Anthropometry | Arm fat % R | white British | Covariate-only model | R2 | 0.462 | [0.457, 0.468] | <1.0x10-300 |
| Anthropometry | Arm fat % R | white British | Genotype-only model | R2 | 0.051 | [0.048, 0.055] | <1.0x10-300 |
| Anthropometry | Arm fat % R | white British | Full model (covariates and genotypes) | R2 | 0.514 | [0.509, 0.520] | <1.0x10-300 |
| Anthropometry | Arm fat % R | Non-British white | Covariate-only model | R2 | 0.426 | [0.399, 0.454] | <1.0x10-300 |
| Anthropometry | Arm fat % R | Non-British white | Genotype-only model | R2 | 0.050 | [0.034, 0.065] | 3.4x10⁻³³ |
| Anthropometry | Arm fat % R | Non-British white | Full model (covariates and genotypes) | R2 | 0.482 | [0.456, 0.508] | <1.0x10-300 |
| Anthropometry | Arm fat % R | South Asian | Covariate-only model | R2 | 0.634 | [0.604, 0.663] | 1.9x10-308 |
| Anthropometry | Arm fat % R | South Asian | Genotype-only model | R2 | 0.033 | [0.015, 0.050] | 4.0x10⁻¹² |
| Anthropometry | Arm fat % R | South Asian | Full model (covariates and genotypes) | R2 | 0.649 | [0.621, 0.678] | <1.0x10-300 |
| Anthropometry | Arm fat % R | African | Covariate-only model | R2 | 0.636 | [0.603, 0.668] | 1.5x10-257 |
| Anthropometry | Arm fat % R | African | Genotype-only model | R2 | 0.010 | [-0.001, 0.021] | 6.7x10-04 |
| Anthropometry | Arm fat % R | African | Full model (covariates and genotypes) | R2 | 0.618 | [0.584, 0.651] | 2.6x10-245 |
| Anthropometry | Arm fat % R | Others | Covariate-only model | R2 | 0.441 | [0.424, 0.457] | <1.0x10-300 |
| Anthropometry | Arm fat % R | Others | Genotype-only model | R2 | 0.050 | [0.041, 0.059] | 2.9x10-89 |
| Anthropometry | Arm fat % R | Others | Full model (covariates and genotypes) | R2 | 0.482 | [0.466, 0.498] | <1.0x10-300 |
| Anthropometry | Arm fat mass R | white British | Covariate-only model | R2 | 0.064 | [0.060, 0.068] | <1.0x10-300 |
| Anthropometry | Arm fat mass R | white British | Genotype-only model | R2 | 0.086 | [0.082, 0.090] | <1.0x10-300 |
| Anthropometry | Arm fat mass R | white British | Full model (covariates and genotypes) | R2 | 0.149 | [0.144, 0.154] | <1.0x10-300 |
| Anthropometry | Arm fat mass R | Non-British white | Covariate-only model | R2 | 0.041 | [0.027, 0.055] | 1.4x10⁻²⁷ |
| Anthropometry | Arm fat mass R | Non-British white | Genotype-only model | R2 | 0.082 | [0.063, 0.101] | 1.4x10-54 |
| Anthropometry | Arm fat mass R | Non-British white | Full model (covariates and genotypes) | R2 | 0.124 | [0.101, 0.146] | 1.7x10-83 |
| Anthropometry | Arm fat mass R | South Asian | Covariate-only model | R2 | 0.150 | [0.116, 0.183] | 4.0x10-53 |
| Anthropometry | Arm fat mass R | South Asian | Genotype-only model | R2 | 0.074 | [0.048, 0.099] | 4.9x10⁻²⁶ |
| Anthropometry | Arm fat mass R | South Asian | Full model (covariates and genotypes) | R2 | 0.198 | [0.162, 0.234] | 1.0x10-71 |
| Anthropometry | Arm fat mass R | African | Covariate-only model | R2 | 0.190 | [0.151, 0.230] | 2.6x10-55 |
| Anthropometry | Arm fat mass R | African | Genotype-only model | R2 | 0.008 | [-0.002, 0.019] | 1.6x10-03 |
| Anthropometry | Arm fat mass R | African | Full model (covariates and genotypes) | R2 | 0.134 | [0.098, 0.170] | 2.7x10-38 |
| Anthropometry | Arm fat mass R | Others | Covariate-only model | R2 | 0.078 | [0.066, 0.089] | 1.6x10-139 |
| Anthropometry | Arm fat mass R | Others | Genotype-only model | R2 | 0.080 | [0.068, 0.091] | 2.1x10-143 |
| Anthropometry | Arm fat mass R | Others | Full model (covariates and genotypes) | R2 | 0.146 | [0.131, 0.160] | 4.6x10-270 |
| Anthropometry | Arm fat-free mass R | white British | Covariate-only model | R2 | 0.721 | [0.717, 0.724] | <1.0x10-300 |
| Anthropometry | Arm fat-free mass R | white British | Genotype-only model | R2 | 0.042 | [0.039, 0.045] | <1.0x10-300 |
| Anthropometry | Arm fat-free mass R | white British | Full model (covariates and genotypes) | R2 | 0.763 | [0.760, 0.766] | <1.0x10-300 |
| Anthropometry | Arm fat-free mass R | Non-British white | Covariate-only model | R2 | 0.716 | [0.699, 0.734] | <1.0x10-300 |
| Anthropometry | Arm fat-free mass R | Non-British white | Genotype-only model | R2 | 0.055 | [0.039, 0.071] | 5.9x10-37 |
| Anthropometry | Arm fat-free mass R | Non-British white | Full model (covariates and genotypes) | R2 | 0.763 | [0.748, 0.778] | <1.0x10-300 |
| Anthropometry | Arm fat-free mass R | South Asian | Covariate-only model | R2 | 0.689 | [0.663, 0.715] | <1.0x10-300 |
| Anthropometry | Arm fat-free mass R | South Asian | Genotype-only model | R2 | 0.026 | [0.010, 0.042] | 7.4x10⁻¹⁰ |
| Anthropometry | Arm fat-free mass R | South Asian | Full model (covariates and genotypes) | R2 | 0.725 | [0.701, 0.749] | <1.0x10-300 |
| Anthropometry | Arm fat-free mass R | African | Covariate-only model | R2 | 0.642 | [0.609, 0.674] | 1.3x10-261 |
| Anthropometry | Arm fat-free mass R | African | Genotype-only model | R2 | 0.009 | [-0.001, 0.020] | 9.7x10-04 |
| Anthropometry | Arm fat-free mass R | African | Full model (covariates and genotypes) | R2 | 0.644 | [0.612, 0.676] | 2.2x10-263 |
| Anthropometry | Arm fat-free mass R | Others | Covariate-only model | R2 | 0.730 | [0.720, 0.741] | <1.0x10-300 |
| Anthropometry | Arm fat-free mass R | Others | Genotype-only model | R2 | 0.032 | [0.025, 0.040] | 6.8x10-58 |
| Anthropometry | Arm fat-free mass R | Others | Full model (covariates and genotypes) | R2 | 0.761 | [0.752, 0.770] | <1.0x10-300 |
| Anthropometry | Arm fat % L | white British | Covariate-only model | R2 | 0.465 | [0.460, 0.471] | <1.0x10-300 |
| Anthropometry | Arm fat % L | white British | Genotype-only model | R2 | 0.052 | [0.049, 0.056] | <1.0x10-300 |
| Anthropometry | Arm fat % L | white British | Full model (covariates and genotypes) | R2 | 0.519 | [0.513, 0.524] | <1.0x10-300 |
| Anthropometry | Arm fat % L | Non-British white | Covariate-only model | R2 | 0.428 | [0.400, 0.455] | <1.0x10-300 |
| Anthropometry | Arm fat % L | Non-British white | Genotype-only model | R2 | 0.048 | [0.033, 0.063] | 3.8x10⁻³² |
| Anthropometry | Arm fat % L | Non-British white | Full model (covariates and genotypes) | R2 | 0.483 | [0.457, 0.510] | <1.0x10-300 |
| Anthropometry | Arm fat % L | South Asian | Covariate-only model | R2 | 0.604 | [0.573, 0.636] | 6.1x10-295 |
| Anthropometry | Arm fat % L | South Asian | Genotype-only model | R2 | 0.038 | [0.019, 0.057] | 7.8x10⁻¹⁴ |
| Anthropometry | Arm fat % L | South Asian | Full model (covariates and genotypes) | R2 | 0.624 | [0.594, 0.654] | 1.9x10-308 |
| Anthropometry | Arm fat % L | African | Covariate-only model | R2 | 0.623 | [0.590, 0.656] | 8.3x10-249 |
| Anthropometry | Arm fat % L | African | Genotype-only model | R2 | 0.010 | [-0.001, 0.021] | 7.7x10-04 |
| Anthropometry | Arm fat % L | African | Full model (covariates and genotypes) | R2 | 0.606 | [0.572, 0.641] | 6.6x10-238 |
| Anthropometry | Arm fat % L | Others | Covariate-only model | R2 | 0.437 | [0.421, 0.453] | <1.0x10-300 |
| Anthropometry | Arm fat % L | Others | Genotype-only model | R2 | 0.051 | [0.042, 0.060] | 2.1x10-91 |
| Anthropometry | Arm fat % L | Others | Full model (covariates and genotypes) | R2 | 0.480 | [0.465, 0.496] | <1.0x10-300 |
| Anthropometry | Arm fat mass L | white British | Covariate-only model | R2 | 0.062 | [0.059, 0.066] | <1.0x10-300 |
| Anthropometry | Arm fat mass L | white British | Genotype-only model | R2 | 0.084 | [0.080, 0.088] | <1.0x10-300 |
| Anthropometry | Arm fat mass L | white British | Full model (covariates and genotypes) | R2 | 0.144 | [0.139, 0.149] | <1.0x10-300 |
| Anthropometry | Arm fat mass L | Non-British white | Covariate-only model | R2 | 0.040 | [0.026, 0.054] | 4.4x10⁻²⁷ |
| Anthropometry | Arm fat mass L | Non-British white | Genotype-only model | R2 | 0.078 | [0.059, 0.097] | 6.0x10-52 |
| Anthropometry | Arm fat mass L | Non-British white | Full model (covariates and genotypes) | R2 | 0.120 | [0.097, 0.142] | 2.0x10-80 |
| Anthropometry | Arm fat mass L | South Asian | Covariate-only model | R2 | 0.139 | [0.107, 0.172] | 2.9x10-49 |
| Anthropometry | Arm fat mass L | South Asian | Genotype-only model | R2 | 0.070 | [0.045, 0.095] | 8.6x10⁻²⁵ |
| Anthropometry | Arm fat mass L | South Asian | Full model (covariates and genotypes) | R2 | 0.187 | [0.151, 0.222] | 3.5x10-67 |
| Anthropometry | Arm fat mass L | African | Covariate-only model | R2 | 0.181 | [0.142, 0.220] | 1.7x10-52 |
| Anthropometry | Arm fat mass L | African | Genotype-only model | R2 | 0.007 | [-0.002, 0.016] | 4.2x10-03 |
| Anthropometry | Arm fat mass L | African | Full model (covariates and genotypes) | R2 | 0.124 | [0.090, 0.159] | 1.7x10⁻³⁵ |
| Anthropometry | Arm fat mass L | Others | Covariate-only model | R2 | 0.074 | [0.063, 0.085] | 4.1x10-133 |
| Anthropometry | Arm fat mass L | Others | Genotype-only model | R2 | 0.077 | [0.066, 0.089] | 3.6x10-139 |
| Anthropometry | Arm fat mass L | Others | Full model (covariates and genotypes) | R2 | 0.140 | [0.126, 0.154] | 9.2x10-259 |
| Anthropometry | Arm fat-free mass L | white British | Covariate-only model | R2 | 0.692 | [0.688, 0.696] | <1.0x10-300 |
| Anthropometry | Arm fat-free mass L | white British | Genotype-only model | R2 | 0.046 | [0.043, 0.049] | <1.0x10-300 |
| Anthropometry | Arm fat-free mass L | white British | Full model (covariates and genotypes) | R2 | 0.738 | [0.735, 0.742] | <1.0x10-300 |
| Anthropometry | Arm fat-free mass L | Non-British white | Covariate-only model | R2 | 0.690 | [0.671, 0.708] | <1.0x10-300 |
| Anthropometry | Arm fat-free mass L | Non-British white | Genotype-only model | R2 | 0.059 | [0.043, 0.076] | 1.1x10-39 |
| Anthropometry | Arm fat-free mass L | Non-British white | Full model (covariates and genotypes) | R2 | 0.740 | [0.724, 0.757] | <1.0x10-300 |
| Anthropometry | Arm fat-free mass L | South Asian | Covariate-only model | R2 | 0.630 | [0.600, 0.660] | 1.9x10-308 |
| Anthropometry | Arm fat-free mass L | South Asian | Genotype-only model | R2 | 0.036 | [0.017, 0.054] | 4.0x10⁻¹³ |
| Anthropometry | Arm fat-free mass L | South Asian | Full model (covariates and genotypes) | R2 | 0.673 | [0.646, 0.700] | <1.0x10-300 |
| Anthropometry | Arm fat-free mass L | African | Covariate-only model | R2 | 0.582 | [0.546, 0.618] | 1.7x10-222 |
| Anthropometry | Arm fat-free mass L | African | Genotype-only model | R2 | 0.007 | [-0.002, 0.017] | 3.3x10-03 |
| Anthropometry | Arm fat-free mass L | African | Full model (covariates and genotypes) | R2 | 0.583 | [0.547, 0.619] | 3.6x10-223 |
| Anthropometry | Arm fat-free mass L | Others | Covariate-only model | R2 | 0.701 | [0.690, 0.712] | <1.0x10-300 |
| Anthropometry | Arm fat-free mass L | Others | Genotype-only model | R2 | 0.036 | [0.028, 0.044] | 8.7x10-64 |
| Anthropometry | Arm fat-free mass L | Others | Full model (covariates and genotypes) | R2 | 0.735 | [0.726, 0.745] | <1.0x10-300 |
| Anthropometry | Trunk fat % | white British | Covariate-only model | R2 | 0.193 | [0.188, 0.198] | <1.0x10-300 |
| Anthropometry | Trunk fat % | white British | Genotype-only model | R2 | 0.080 | [0.076, 0.084] | <1.0x10-300 |
| Anthropometry | Trunk fat % | white British | Full model (covariates and genotypes) | R2 | 0.274 | [0.268, 0.280] | <1.0x10-300 |
| Anthropometry | Trunk fat % | Non-British white | Covariate-only model | R2 | 0.162 | [0.137, 0.186] | 1.1x10-110 |
| Anthropometry | Trunk fat % | Non-British white | Genotype-only model | R2 | 0.091 | [0.071, 0.111] | 1.1x10-60 |
| Anthropometry | Trunk fat % | Non-British white | Full model (covariates and genotypes) | R2 | 0.253 | [0.225, 0.280] | 1.5x10-181 |
| Anthropometry | Trunk fat % | South Asian | Covariate-only model | R2 | 0.257 | [0.219, 0.295] | 1.2x10-95 |
| Anthropometry | Trunk fat % | South Asian | Genotype-only model | R2 | 0.070 | [0.045, 0.095] | 9.8x10⁻²⁵ |
| Anthropometry | Trunk fat % | South Asian | Full model (covariates and genotypes) | R2 | 0.313 | [0.274, 0.352] | 1.3x10-120 |
| Anthropometry | Trunk fat % | African | Covariate-only model | R2 | 0.356 | [0.312, 0.399] | 4.4x10-113 |
| Anthropometry | Trunk fat % | African | Genotype-only model | R2 | 0.011 | [-0.001, 0.023] | 3.0x10-04 |
| Anthropometry | Trunk fat % | African | Full model (covariates and genotypes) | R2 | 0.323 | [0.280, 0.366] | 1.5x10-100 |
| Anthropometry | Trunk fat % | Others | Covariate-only model | R2 | 0.174 | [0.159, 0.189] | <1.0x10-300 |
| Anthropometry | Trunk fat % | Others | Genotype-only model | R2 | 0.081 | [0.070, 0.093] | 3.8x10-146 |
| Anthropometry | Trunk fat % | Others | Full model (covariates and genotypes) | R2 | 0.237 | [0.221, 0.253] | <1.0x10-300 |
| Anthropometry | Trunk fat mass | white British | Covariate-only model | R2 | 0.013 | [0.011, 0.015] | 3.5x10-193 |
| Anthropometry | Trunk fat mass | white British | Genotype-only model | R2 | 0.116 | [0.111, 0.120] | <1.0x10-300 |
| Anthropometry | Trunk fat mass | white British | Full model (covariates and genotypes) | R2 | 0.128 | [0.123, 0.132] | <1.0x10-300 |
| Anthropometry | Trunk fat mass | Non-British white | Covariate-only model | R2 | 0.011 | [0.003, 0.018] | 2.4x10-08 |
| Anthropometry | Trunk fat mass | Non-British white | Genotype-only model | R2 | 0.132 | [0.109, 0.155] | 1.5x10-89 |
| Anthropometry | Trunk fat mass | Non-British white | Full model (covariates and genotypes) | R2 | 0.139 | [0.116, 0.162] | 3.6x10-94 |
| Anthropometry | Trunk fat mass | South Asian | Covariate-only model | R2 | 0.022 | [0.007, 0.036] | 1.7x10-08 |
| Anthropometry | Trunk fat mass | South Asian | Genotype-only model | R2 | 0.114 | [0.084, 0.145] | 2.8x10-40 |
| Anthropometry | Trunk fat mass | South Asian | Full model (covariates and genotypes) | R2 | 0.128 | [0.097, 0.160] | 2.9x10-45 |
| Anthropometry | Trunk fat mass | African | Covariate-only model | R2 | 0.008 | [-0.002, 0.019] | 1.8x10-03 |
| Anthropometry | Trunk fat mass | African | Genotype-only model | R2 | 0.016 | [0.002, 0.030] | 1.4x10-05 |
| Anthropometry | Trunk fat mass | African | Full model (covariates and genotypes) | R2 | 0.023 | [0.006, 0.040] | 1.9x10-07 |
| Anthropometry | Trunk fat mass | Others | Covariate-only model | R2 | 0.059 | [0.049, 0.069] | 1.9x10-105 |
| Anthropometry | Trunk fat mass | Others | Genotype-only model | R2 | 0.106 | [0.093, 0.118] | 3.5x10-192 |
| Anthropometry | Trunk fat mass | Others | Full model (covariates and genotypes) | R2 | 0.146 | [0.132, 0.160] | 9.1x10-271 |
| Anthropometry | Trunk fat-free mass | white British | Covariate-only model | R2 | 0.717 | [0.713, 0.720] | <1.0x10-300 |
| Anthropometry | Trunk fat-free mass | white British | Genotype-only model | R2 | 0.053 | [0.050, 0.057] | <1.0x10-300 |
| Anthropometry | Trunk fat-free mass | white British | Full model (covariates and genotypes) | R2 | 0.770 | [0.767, 0.773] | <1.0x10-300 |
| Anthropometry | Trunk fat-free mass | Non-British white | Covariate-only model | R2 | 0.709 | [0.692, 0.727] | <1.0x10-300 |
| Anthropometry | Trunk fat-free mass | Non-British white | Genotype-only model | R2 | 0.070 | [0.052, 0.088] | 1.6x10-46 |
| Anthropometry | Trunk fat-free mass | Non-British white | Full model (covariates and genotypes) | R2 | 0.768 | [0.753, 0.783] | <1.0x10-300 |
| Anthropometry | Trunk fat-free mass | South Asian | Covariate-only model | R2 | 0.638 | [0.609, 0.668] | 1.9x10-308 |
| Anthropometry | Trunk fat-free mass | South Asian | Genotype-only model | R2 | 0.029 | [0.012, 0.045] | 7.9x10⁻¹¹ |
| Anthropometry | Trunk fat-free mass | South Asian | Full model (covariates and genotypes) | R2 | 0.684 | [0.658, 0.711] | <1.0x10-300 |
| Anthropometry | Trunk fat-free mass | African | Covariate-only model | R2 | 0.584 | [0.549, 0.620] | 6.0x10-224 |
| Anthropometry | Trunk fat-free mass | African | Genotype-only model | R2 | 0.009 | [-0.002, 0.019] | 1.5x10-03 |
| Anthropometry | Trunk fat-free mass | African | Full model (covariates and genotypes) | R2 | 0.590 | [0.555, 0.625] | 2.2x10-227 |
| Anthropometry | Trunk fat-free mass | Others | Covariate-only model | R2 | 0.711 | [0.700, 0.722] | <1.0x10-300 |
| Anthropometry | Trunk fat-free mass | Others | Genotype-only model | R2 | 0.041 | [0.032, 0.049] | 1.1x10-72 |
| Anthropometry | Trunk fat-free mass | Others | Full model (covariates and genotypes) | R2 | 0.752 | [0.743, 0.762] | <1.0x10-300 |
| Anthropometry | Waist circumference | white British | Covariate-only model | R2 | 0.231 | [0.226, 0.237] | <1.0x10-300 |
| Anthropometry | Waist circumference | white British | Genotype-only model | R2 | 0.071 | [0.067, 0.075] | <1.0x10-300 |
| Anthropometry | Waist circumference | white British | Full model (covariates and genotypes) | R2 | 0.299 | [0.294, 0.305] | <1.0x10-300 |
| Anthropometry | Waist circumference | Non-British white | Covariate-only model | R2 | 0.236 | [0.209, 0.263] | 8.4x10-171 |
| Anthropometry | Waist circumference | Non-British white | Genotype-only model | R2 | 0.074 | [0.055, 0.092] | 7.1x10-50 |
| Anthropometry | Waist circumference | Non-British white | Full model (covariates and genotypes) | R2 | 0.299 | [0.271, 0.326] | 3.6x10-224 |
| Anthropometry | Waist circumference | South Asian | Covariate-only model | R2 | 0.146 | [0.113, 0.179] | 1.9x10-52 |
| Anthropometry | Waist circumference | South Asian | Genotype-only model | R2 | 0.067 | [0.043, 0.091] | 5.6x10⁻²⁴ |
| Anthropometry | Waist circumference | South Asian | Full model (covariates and genotypes) | R2 | 0.211 | [0.175, 0.248] | 8.3x10-78 |
| Anthropometry | Waist circumference | African | Covariate-only model | R2 | 0.018 | [0.003, 0.033] | 3.4x10-06 |
| Anthropometry | Waist circumference | African | Genotype-only model | R2 | 0.016 | [0.002, 0.031] | 8.8x10-06 |
| Anthropometry | Waist circumference | African | Full model (covariates and genotypes) | R2 | 0.031 | [0.012, 0.050] | 8.7x10⁻¹⁰ |
| Anthropometry | Waist circumference | Others | Covariate-only model | R2 | 0.244 | [0.227, 0.260] | <1.0x10-300 |
| Anthropometry | Waist circumference | Others | Genotype-only model | R2 | 0.051 | [0.041, 0.060] | 3.2x10-92 |
| Anthropometry | Waist circumference | Others | Full model (covariates and genotypes) | R2 | 0.289 | [0.272, 0.306] | <1.0x10-300 |
| Anthropometry | Hip circumference | white British | Covariate-only model | R2 | 0.005 | [0.004, 0.006] | 1.1x10-74 |
| Anthropometry | Hip circumference | white British | Genotype-only model | R2 | 0.103 | [0.098, 0.107] | <1.0x10-300 |
| Anthropometry | Hip circumference | white British | Full model (covariates and genotypes) | R2 | 0.107 | [0.102, 0.111] | <1.0x10-300 |
| Anthropometry | Hip circumference | Non-British white | Covariate-only model | R2 | 0.001 | [-0.001, 0.003] | 1.0x10-01 |
| Anthropometry | Hip circumference | Non-British white | Genotype-only model | R2 | 0.105 | [0.084, 0.126] | 1.9x10-71 |
| Anthropometry | Hip circumference | Non-British white | Full model (covariates and genotypes) | R2 | 0.103 | [0.082, 0.124] | 5.1x10-70 |
| Anthropometry | Hip circumference | South Asian | Covariate-only model | R2 | 0.019 | [0.005, 0.032] | 1.4x10-07 |
| Anthropometry | Hip circumference | South Asian | Genotype-only model | R2 | 0.085 | [0.058, 0.112] | 2.3x10⁻³⁰ |
| Anthropometry | Hip circumference | South Asian | Full model (covariates and genotypes) | R2 | 0.098 | [0.070, 0.127] | 6.5x10⁻³⁵ |
| Anthropometry | Hip circumference | African | Covariate-only model | R2 | 0.005 | [-0.003, 0.013] | 1.5x10-02 |
| Anthropometry | Hip circumference | African | Genotype-only model | R2 | 0.015 | [0.001, 0.028] | 2.5x10-05 |
| Anthropometry | Hip circumference | African | Full model (covariates and genotypes) | R2 | 0.019 | [0.004, 0.034] | 2.0x10-06 |
| Anthropometry | Hip circumference | Others | Covariate-only model | R2 | 0.056 | [0.047, 0.066] | 1.8x10-102 |
| Anthropometry | Hip circumference | Others | Genotype-only model | R2 | 0.090 | [0.078, 0.102] | 7.5x10-166 |
| Anthropometry | Hip circumference | Others | Full model (covariates and genotypes) | R2 | 0.130 | [0.116, 0.144] | 8.0x10-243 |
| Anthropometry | Height | white British | Covariate-only model | R2 | 0.539 | [0.534, 0.544] | <1.0x10-300 |
| Anthropometry | Height | white British | Genotype-only model | R2 | 0.180 | [0.175, 0.186] | <1.0x10-300 |
| Anthropometry | Height | white British | Full model (covariates and genotypes) | R2 | 0.719 | [0.715, 0.723] | <1.0x10-300 |
| Anthropometry | Height | Non-British white | Covariate-only model | R2 | 0.540 | [0.516, 0.565] | <1.0x10-300 |
| Anthropometry | Height | Non-British white | Genotype-only model | R2 | 0.210 | [0.184, 0.237] | 6.5x10-150 |
| Anthropometry | Height | Non-British white | Full model (covariates and genotypes) | R2 | 0.728 | [0.712, 0.745] | <1.0x10-300 |
| Anthropometry | Height | South Asian | Covariate-only model | R2 | 0.580 | [0.548, 0.613] | 8.2x10-275 |
| Anthropometry | Height | South Asian | Genotype-only model | R2 | 0.083 | [0.056, 0.110] | 3.6x10⁻²⁹ |
| Anthropometry | Height | South Asian | Full model (covariates and genotypes) | R2 | 0.669 | [0.642, 0.697] | <1.0x10-300 |
| Anthropometry | Height | African | Covariate-only model | R2 | 0.489 | [0.449, 0.529] | 2.7x10-175 |
| Anthropometry | Height | African | Genotype-only model | R2 | 0.028 | [0.010, 0.046] | 6.8x10-09 |
| Anthropometry | Height | African | Full model (covariates and genotypes) | R2 | 0.503 | [0.464, 0.543] | 2.6x10-182 |
| Anthropometry | Height | Others | Covariate-only model | R2 | 0.552 | [0.537, 0.566] | <1.0x10-300 |
| Anthropometry | Height | Others | Genotype-only model | R2 | 0.151 | [0.137, 0.165] | 1.6x10-285 |
| Anthropometry | Height | Others | Full model (covariates and genotypes) | R2 | 0.699 | [0.688, 0.710] | <1.0x10-300 |
| Blood assays | Leukocyte count | white British | Covariate-only model | R2 | 0.013 | [0.012, 0.015] | 7.7x10-196 |
| Blood assays | Leukocyte count | white British | Genotype-only model | R2 | 0.076 | [0.073, 0.080] | <1.0x10-300 |
| Blood assays | Leukocyte count | white British | Full model (covariates and genotypes) | R2 | 0.089 | [0.085, 0.093] | <1.0x10-300 |
| Blood assays | Leukocyte count | Non-British white | Covariate-only model | R2 | 0.018 | [0.008, 0.027] | 1.4x10⁻¹² |
| Blood assays | Leukocyte count | Non-British white | Genotype-only model | R2 | 0.076 | [0.058, 0.095] | 2.5x10-50 |
| Blood assays | Leukocyte count | Non-British white | Full model (covariates and genotypes) | R2 | 0.091 | [0.071, 0.111] | 3.2x10-60 |
| Blood assays | Leukocyte count | South Asian | Covariate-only model | R2 | 0.007 | [-0.001, 0.016] | 1.4x10-03 |
| Blood assays | Leukocyte count | South Asian | Genotype-only model | R2 | 0.090 | [0.062, 0.117] | 4.2x10⁻³¹ |
| Blood assays | Leukocyte count | South Asian | Full model (covariates and genotypes) | R2 | 0.094 | [0.066, 0.122] | 2.0x10⁻³² |
| Blood assays | Leukocyte count | African | Covariate-only model | R2 | 0.008 | [-0.002, 0.018] | 2.8x10-03 |
| Blood assays | Leukocyte count | African | Genotype-only model | R2 | 0.044 | [0.022, 0.067] | 5.4x10⁻¹³ |
| Blood assays | Leukocyte count | African | Full model (covariates and genotypes) | R2 | 0.051 | [0.027, 0.075] | 9.2x10⁻¹⁵ |
| Blood assays | Leukocyte count | Others | Covariate-only model | R2 | 0.028 | [0.021, 0.035] | 2.4x10-49 |
| Blood assays | Leukocyte count | Others | Genotype-only model | R2 | 0.082 | [0.071, 0.094] | 6.8x10-147 |
| Blood assays | Leukocyte count | Others | Full model (covariates and genotypes) | R2 | 0.098 | [0.086, 0.111] | 2.7x10-176 |
| Blood assays | Erythrocyte count | white British | Covariate-only model | R2 | 0.265 | [0.260, 0.271] | <1.0x10-300 |
| Blood assays | Erythrocyte count | white British | Genotype-only model | R2 | 0.118 | [0.113, 0.122] | <1.0x10-300 |
| Blood assays | Erythrocyte count | white British | Full model (covariates and genotypes) | R2 | 0.382 | [0.376, 0.388] | <1.0x10-300 |
| Blood assays | Erythrocyte count | Non-British white | Covariate-only model | R2 | 0.296 | [0.268, 0.324] | 1.2x10-216 |
| Blood assays | Erythrocyte count | Non-British white | Genotype-only model | R2 | 0.093 | [0.073, 0.113] | 1.7x10-61 |
| Blood assays | Erythrocyte count | Non-British white | Full model (covariates and genotypes) | R2 | 0.389 | [0.362, 0.417] | 3.3x10-303 |
| Blood assays | Erythrocyte count | South Asian | Covariate-only model | R2 | 0.277 | [0.238, 0.315] | 1.1x10-102 |
| Blood assays | Erythrocyte count | South Asian | Genotype-only model | R2 | 0.075 | [0.049, 0.101] | 4.8x10⁻²⁶ |
| Blood assays | Erythrocyte count | South Asian | Full model (covariates and genotypes) | R2 | 0.353 | [0.314, 0.392] | 3.2x10-137 |
| Blood assays | Erythrocyte count | African | Covariate-only model | R2 | 0.259 | [0.217, 0.302] | 3.7x10-77 |
| Blood assays | Erythrocyte count | African | Genotype-only model | R2 | 0.041 | [0.020, 0.063] | 2.8x10⁻¹² |
| Blood assays | Erythrocyte count | African | Full model (covariates and genotypes) | R2 | 0.295 | [0.252, 0.338] | 1.9x10-89 |
| Blood assays | Erythrocyte count | Others | Covariate-only model | R2 | 0.311 | [0.294, 0.327] | <1.0x10-300 |
| Blood assays | Erythrocyte count | Others | Genotype-only model | R2 | 0.101 | [0.089, 0.114] | 3.5x10-182 |
| Blood assays | Erythrocyte count | Others | Full model (covariates and genotypes) | R2 | 0.388 | [0.371, 0.405] | <1.0x10-300 |
| Blood assays | Hemoglobin conc. | white British | Covariate-only model | R2 | 0.369 | [0.363, 0.375] | <1.0x10-300 |
| Blood assays | Hemoglobin conc. | white British | Genotype-only model | R2 | 0.068 | [0.065, 0.072] | <1.0x10-300 |
| Blood assays | Hemoglobin conc. | white British | Full model (covariates and genotypes) | R2 | 0.438 | [0.432, 0.443] | <1.0x10-300 |
| Blood assays | Hemoglobin conc. | Non-British white | Covariate-only model | R2 | 0.399 | [0.371, 0.427] | 1.9x10-308 |
| Blood assays | Hemoglobin conc. | Non-British white | Genotype-only model | R2 | 0.063 | [0.046, 0.080] | 1.7x10-41 |
| Blood assays | Hemoglobin conc. | Non-British white | Full model (covariates and genotypes) | R2 | 0.465 | [0.438, 0.491] | <1.0x10-300 |
| Blood assays | Hemoglobin conc. | South Asian | Covariate-only model | R2 | 0.397 | [0.359, 0.436] | 2.5x10-159 |
| Blood assays | Hemoglobin conc. | South Asian | Genotype-only model | R2 | 0.029 | [0.012, 0.045] | 1.1x10⁻¹⁰ |
| Blood assays | Hemoglobin conc. | South Asian | Full model (covariates and genotypes) | R2 | 0.430 | [0.392, 0.468] | 9.7x10-177 |
| Blood assays | Hemoglobin conc. | African | Covariate-only model | R2 | 0.394 | [0.352, 0.437] | 1.2x10-127 |
| Blood assays | Hemoglobin conc. | African | Genotype-only model | R2 | 0.018 | [0.003, 0.032] | 6.2x10-06 |
| Blood assays | Hemoglobin conc. | African | Full model (covariates and genotypes) | R2 | 0.401 | [0.359, 0.444] | 2.0x10-130 |
| Blood assays | Hemoglobin conc. | Others | Covariate-only model | R2 | 0.393 | [0.376, 0.410] | <1.0x10-300 |
| Blood assays | Hemoglobin conc. | Others | Genotype-only model | R2 | 0.048 | [0.039, 0.057] | 3.0x10-85 |
| Blood assays | Hemoglobin conc. | Others | Full model (covariates and genotypes) | R2 | 0.435 | [0.419, 0.452] | <1.0x10-300 |
| Blood assays | Hematocrit % | white British | Covariate-only model | R2 | 0.333 | [0.327, 0.339] | <1.0x10-300 |
| Blood assays | Hematocrit % | white British | Genotype-only model | R2 | 0.067 | [0.064, 0.071] | <1.0x10-300 |
| Blood assays | Hematocrit % | white British | Full model (covariates and genotypes) | R2 | 0.400 | [0.394, 0.405] | <1.0x10-300 |
| Blood assays | Hematocrit % | Non-British white | Covariate-only model | R2 | 0.367 | [0.339, 0.395] | 1.3x10-281 |
| Blood assays | Hematocrit % | Non-British white | Genotype-only model | R2 | 0.058 | [0.041, 0.074] | 2.3x10-38 |
| Blood assays | Hematocrit % | Non-British white | Full model (covariates and genotypes) | R2 | 0.426 | [0.398, 0.453] | <1.0x10-300 |
| Blood assays | Hematocrit % | South Asian | Covariate-only model | R2 | 0.390 | [0.351, 0.429] | 1.4x10-155 |
| Blood assays | Hematocrit % | South Asian | Genotype-only model | R2 | 0.033 | [0.015, 0.051] | 3.9x10⁻¹² |
| Blood assays | Hematocrit % | South Asian | Full model (covariates and genotypes) | R2 | 0.426 | [0.388, 0.464] | 2.5x10-174 |
| Blood assays | Hematocrit % | African | Covariate-only model | R2 | 0.406 | [0.363, 0.448] | 2.3x10-132 |
| Blood assays | Hematocrit % | African | Genotype-only model | R2 | 0.016 | [0.002, 0.030] | 1.5x10-05 |
| Blood assays | Hematocrit % | African | Full model (covariates and genotypes) | R2 | 0.413 | [0.370, 0.455] | 2.4x10-135 |
| Blood assays | Hematocrit % | Others | Covariate-only model | R2 | 0.359 | [0.342, 0.375] | <1.0x10-300 |
| Blood assays | Hematocrit % | Others | Genotype-only model | R2 | 0.049 | [0.039, 0.058] | 6.3x10-86 |
| Blood assays | Hematocrit % | Others | Full model (covariates and genotypes) | R2 | 0.404 | [0.387, 0.420] | <1.0x10-300 |
| Blood assays | Mean corpuscular vol. | white British | Covariate-only model | R2 | 0.018 | [0.016, 0.020] | 4.4x10-264 |
| Blood assays | Mean corpuscular vol. | white British | Genotype-only model | R2 | 0.200 | [0.194, 0.205] | <1.0x10-300 |
| Blood assays | Mean corpuscular vol. | white British | Full model (covariates and genotypes) | R2 | 0.215 | [0.209, 0.220] | <1.0x10-300 |
| Blood assays | Mean corpuscular vol. | Non-British white | Covariate-only model | R2 | 0.026 | [0.015, 0.038] | 4.4x10⁻¹⁸ |
| Blood assays | Mean corpuscular vol. | Non-British white | Genotype-only model | R2 | 0.196 | [0.170, 0.222] | 1.4x10-135 |
| Blood assays | Mean corpuscular vol. | Non-British white | Full model (covariates and genotypes) | R2 | 0.219 | [0.192, 0.245] | 9.7x10-153 |
| Blood assays | Mean corpuscular vol. | South Asian | Covariate-only model | R2 | 0.037 | [0.018, 0.056] | 2.3x10⁻¹³ |
| Blood assays | Mean corpuscular vol. | South Asian | Genotype-only model | R2 | 0.101 | [0.072, 0.130] | 6.5x10⁻³⁵ |
| Blood assays | Mean corpuscular vol. | South Asian | Full model (covariates and genotypes) | R2 | 0.131 | [0.099, 0.163] | 1.3x10-45 |
| Blood assays | Mean corpuscular vol. | African | Covariate-only model | R2 | 0.023 | [0.006, 0.039] | 2.6x10-07 |
| Blood assays | Mean corpuscular vol. | African | Genotype-only model | R2 | 0.058 | [0.033, 0.084] | 9.6x10⁻¹⁷ |
| Blood assays | Mean corpuscular vol. | African | Full model (covariates and genotypes) | R2 | 0.075 | [0.047, 0.104] | 2.3x10⁻²¹ |
| Blood assays | Mean corpuscular vol. | Others | Covariate-only model | R2 | 0.076 | [0.065, 0.087] | 2.3x10-135 |
| Blood assays | Mean corpuscular vol. | Others | Genotype-only model | R2 | 0.141 | [0.127, 0.155] | 7.8x10-258 |
| Blood assays | Mean corpuscular vol. | Others | Full model (covariates and genotypes) | R2 | 0.188 | [0.173, 0.204] | <1.0x10-300 |
| Blood assays | Mean corpuscular hemoglobin | white British | Covariate-only model | R2 | 0.020 | [0.018, 0.022] | 4.7x10-292 |
| Blood assays | Mean corpuscular hemoglobin | white British | Genotype-only model | R2 | 0.167 | [0.162, 0.172] | <1.0x10-300 |
| Blood assays | Mean corpuscular hemoglobin | white British | Full model (covariates and genotypes) | R2 | 0.184 | [0.179, 0.190] | <1.0x10-300 |
| Blood assays | Mean corpuscular hemoglobin | Non-British white | Covariate-only model | R2 | 0.028 | [0.016, 0.040] | 4.5x10⁻¹⁹ |
| Blood assays | Mean corpuscular hemoglobin | Non-British white | Genotype-only model | R2 | 0.183 | [0.158, 0.209] | 1.2x10-125 |
| Blood assays | Mean corpuscular hemoglobin | Non-British white | Full model (covariates and genotypes) | R2 | 0.205 | [0.179, 0.231] | 4.3x10-142 |
| Blood assays | Mean corpuscular hemoglobin | South Asian | Covariate-only model | R2 | 0.034 | [0.016, 0.052] | 2.1x10⁻¹² |
| Blood assays | Mean corpuscular hemoglobin | South Asian | Genotype-only model | R2 | 0.086 | [0.059, 0.114] | 6.3x10⁻³⁰ |
| Blood assays | Mean corpuscular hemoglobin | South Asian | Full model (covariates and genotypes) | R2 | 0.116 | [0.085, 0.146] | 3.5x10-40 |
| Blood assays | Mean corpuscular hemoglobin | African | Covariate-only model | R2 | 0.022 | [0.005, 0.038] | 5.3x10-07 |
| Blood assays | Mean corpuscular hemoglobin | African | Genotype-only model | R2 | 0.055 | [0.030, 0.079] | 8.5x10⁻¹⁶ |
| Blood assays | Mean corpuscular hemoglobin | African | Full model (covariates and genotypes) | R2 | 0.072 | [0.044, 0.100] | 1.9x10⁻²⁰ |
| Blood assays | Mean corpuscular hemoglobin | Others | Covariate-only model | R2 | 0.083 | [0.071, 0.094] | 6.2x10-147 |
| Blood assays | Mean corpuscular hemoglobin | Others | Genotype-only model | R2 | 0.128 | [0.114, 0.141] | 7.3x10-232 |
| Blood assays | Mean corpuscular hemoglobin | Others | Full model (covariates and genotypes) | R2 | 0.174 | [0.159, 0.189] | 1.9x10-308 |
| Blood assays | Mean corpuscular hemoglobin conc. | white British | Covariate-only model | R2 | 0.015 | [0.013, 0.017] | 6.6x10-218 |
| Blood assays | Mean corpuscular hemoglobin conc. | white British | Genotype-only model | R2 | 0.025 | [0.023, 0.028] | <1.0x10-300 |
| Blood assays | Mean corpuscular hemoglobin conc. | white British | Full model (covariates and genotypes) | R2 | 0.040 | [0.037, 0.043] | <1.0x10-300 |
| Blood assays | Mean corpuscular hemoglobin conc. | Non-British white | Covariate-only model | R2 | 0.020 | [0.010, 0.029] | 1.0x10⁻¹³ |
| Blood assays | Mean corpuscular hemoglobin conc. | Non-British white | Genotype-only model | R2 | 0.032 | [0.019, 0.044] | 1.4x10⁻²¹ |
| Blood assays | Mean corpuscular hemoglobin conc. | Non-British white | Full model (covariates and genotypes) | R2 | 0.049 | [0.033, 0.064] | 2.8x10⁻³² |
| Blood assays | Mean corpuscular hemoglobin conc. | South Asian | Covariate-only model | R2 | 0.009 | [-0.000, 0.019] | 2.6x10-04 |
| Blood assays | Mean corpuscular hemoglobin conc. | South Asian | Genotype-only model | R2 | 0.017 | [0.004, 0.030] | 6.3x10-07 |
| Blood assays | Mean corpuscular hemoglobin conc. | South Asian | Full model (covariates and genotypes) | R2 | 0.025 | [0.010, 0.041] | 1.6x10-09 |
| Blood assays | Mean corpuscular hemoglobin conc. | African | Covariate-only model | R2 | 0.009 | [-0.002, 0.019] | 1.4x10-03 |
| Blood assays | Mean corpuscular hemoglobin conc. | African | Genotype-only model | R2 | 0.009 | [-0.002, 0.019] | 1.6x10-03 |
| Blood assays | Mean corpuscular hemoglobin conc. | African | Full model (covariates and genotypes) | R2 | 0.016 | [0.002, 0.030] | 1.5x10-05 |
| Blood assays | Mean corpuscular hemoglobin conc. | Others | Covariate-only model | R2 | 0.035 | [0.027, 0.043] | 1.5x10-62 |
| Blood assays | Mean corpuscular hemoglobin conc. | Others | Genotype-only model | R2 | 0.024 | [0.017, 0.030] | 1.6x10-42 |
| Blood assays | Mean corpuscular hemoglobin conc. | Others | Full model (covariates and genotypes) | R2 | 0.050 | [0.040, 0.059] | 1.5x10-87 |
| Blood assays | Erythrocyte dist. width | white British | Covariate-only model | R2 | 0.013 | [0.011, 0.014] | 1.4x10-186 |
| Blood assays | Erythrocyte dist. width | white British | Genotype-only model | R2 | 0.079 | [0.076, 0.083] | <1.0x10-300 |
| Blood assays | Erythrocyte dist. width | white British | Full model (covariates and genotypes) | R2 | 0.092 | [0.088, 0.096] | <1.0x10-300 |
| Blood assays | Erythrocyte dist. width | Non-British white | Covariate-only model | R2 | 0.021 | [0.011, 0.032] | 6.8x10⁻¹⁵ |
| Blood assays | Erythrocyte dist. width | Non-British white | Genotype-only model | R2 | 0.087 | [0.068, 0.107] | 7.1x10-58 |
| Blood assays | Erythrocyte dist. width | Non-British white | Full model (covariates and genotypes) | R2 | 0.106 | [0.085, 0.127] | 1.6x10-70 |
| Blood assays | Erythrocyte dist. width | South Asian | Covariate-only model | R2 | 0.015 | [0.003, 0.027] | 4.1x10-06 |
| Blood assays | Erythrocyte dist. width | South Asian | Genotype-only model | R2 | 0.052 | [0.030, 0.075] | 1.6x10⁻¹⁸ |
| Blood assays | Erythrocyte dist. width | South Asian | Full model (covariates and genotypes) | R2 | 0.066 | [0.042, 0.091] | 3.7x10⁻²³ |
| Blood assays | Erythrocyte dist. width | African | Covariate-only model | R2 | 0.008 | [-0.002, 0.018] | 2.2x10-03 |
| Blood assays | Erythrocyte dist. width | African | Genotype-only model | R2 | 0.018 | [0.003, 0.033] | 4.5x10-06 |
| Blood assays | Erythrocyte dist. width | African | Full model (covariates and genotypes) | R2 | 0.026 | [0.009, 0.044] | 2.9x10-08 |
| Blood assays | Erythrocyte dist. width | Others | Covariate-only model | R2 | 0.027 | [0.020, 0.034] | 5.9x10-48 |
| Blood assays | Erythrocyte dist. width | Others | Genotype-only model | R2 | 0.067 | [0.057, 0.078] | 1.4x10-119 |
| Blood assays | Erythrocyte dist. width | Others | Full model (covariates and genotypes) | R2 | 0.088 | [0.076, 0.100] | 1.6x10-156 |
| Blood assays | Platelet count | white British | Covariate-only model | R2 | 0.060 | [0.057, 0.064] | <1.0x10-300 |
| Blood assays | Platelet count | white British | Genotype-only model | R2 | 0.209 | [0.204, 0.215] | <1.0x10-300 |
| Blood assays | Platelet count | white British | Full model (covariates and genotypes) | R2 | 0.268 | [0.263, 0.274] | <1.0x10-300 |
| Blood assays | Platelet count | Non-British white | Covariate-only model | R2 | 0.045 | [0.031, 0.060] | 3.5x10⁻³⁰ |
| Blood assays | Platelet count | Non-British white | Genotype-only model | R2 | 0.225 | [0.198, 0.251] | 1.6x10-157 |
| Blood assays | Platelet count | Non-British white | Full model (covariates and genotypes) | R2 | 0.266 | [0.238, 0.293] | 1.4x10-190 |
| Blood assays | Platelet count | South Asian | Covariate-only model | R2 | 0.085 | [0.058, 0.112] | 2.3x10⁻²⁹ |
| Blood assays | Platelet count | South Asian | Genotype-only model | R2 | 0.156 | [0.122, 0.190] | 1.2x10-54 |
| Blood assays | Platelet count | South Asian | Full model (covariates and genotypes) | R2 | 0.235 | [0.197, 0.272] | 3.7x10-85 |
| Blood assays | Platelet count | African | Covariate-only model | R2 | 0.090 | [0.060, 0.121] | 1.7x10⁻²⁵ |
| Blood assays | Platelet count | African | Genotype-only model | R2 | 0.067 | [0.040, 0.094] | 4.9x10⁻¹⁹ |
| Blood assays | Platelet count | African | Full model (covariates and genotypes) | R2 | 0.139 | [0.103, 0.175] | 1.7x10-39 |
| Blood assays | Platelet count | Others | Covariate-only model | R2 | 0.063 | [0.053, 0.073] | 2.7x10-111 |
| Blood assays | Platelet count | Others | Genotype-only model | R2 | 0.193 | [0.178, 0.209] | <1.0x10-300 |
| Blood assays | Platelet count | Others | Full model (covariates and genotypes) | R2 | 0.249 | [0.232, 0.265] | <1.0x10-300 |
| Blood assays | Platelet crit | white British | Covariate-only model | R2 | 0.089 | [0.085, 0.093] | <1.0x10-300 |
| Blood assays | Platelet crit | white British | Genotype-only model | R2 | 0.163 | [0.158, 0.168] | <1.0x10-300 |
| Blood assays | Platelet crit | white British | Full model (covariates and genotypes) | R2 | 0.252 | [0.246, 0.257] | <1.0x10-300 |
| Blood assays | Platelet crit | Non-British white | Covariate-only model | R2 | 0.075 | [0.057, 0.094] | 1.1x10-49 |
| Blood assays | Platelet crit | Non-British white | Genotype-only model | R2 | 0.177 | [0.152, 0.202] | 7.1x10-121 |
| Blood assays | Platelet crit | Non-British white | Full model (covariates and genotypes) | R2 | 0.248 | [0.221, 0.276] | 1.9x10-176 |
| Blood assays | Platelet crit | South Asian | Covariate-only model | R2 | 0.139 | [0.106, 0.171] | 2.1x10-48 |
| Blood assays | Platelet crit | South Asian | Genotype-only model | R2 | 0.120 | [0.089, 0.151] | 1.2x10-41 |
| Blood assays | Platelet crit | South Asian | Full model (covariates and genotypes) | R2 | 0.248 | [0.210, 0.286] | 1.8x10-90 |
| Blood assays | Platelet crit | African | Covariate-only model | R2 | 0.123 | [0.089, 0.158] | 9.0x10⁻³⁵ |
| Blood assays | Platelet crit | African | Genotype-only model | R2 | 0.044 | [0.021, 0.066] | 6.3x10⁻¹³ |
| Blood assays | Platelet crit | African | Full model (covariates and genotypes) | R2 | 0.152 | [0.115, 0.189] | 2.8x10-43 |
| Blood assays | Platelet crit | Others | Covariate-only model | R2 | 0.095 | [0.083, 0.107] | 1.4x10-169 |
| Blood assays | Platelet crit | Others | Genotype-only model | R2 | 0.138 | [0.124, 0.152] | 1.7x10-252 |
| Blood assays | Platelet crit | Others | Full model (covariates and genotypes) | R2 | 0.229 | [0.213, 0.245] | <1.0x10-300 |
| Blood assays | Mean platelet vol. | white British | Covariate-only model | R2 | 0.003 | [0.002, 0.004] | 2.9x10-45 |
| Blood assays | Mean platelet vol. | white British | Genotype-only model | R2 | 0.358 | [0.353, 0.364] | <1.0x10-300 |
| Blood assays | Mean platelet vol. | white British | Full model (covariates and genotypes) | R2 | 0.361 | [0.355, 0.367] | <1.0x10-300 |
| Blood assays | Mean platelet vol. | Non-British white | Covariate-only model | R2 | 0.008 | [0.002, 0.015] | 1.1x10-06 |
| Blood assays | Mean platelet vol. | Non-British white | Genotype-only model | R2 | 0.359 | [0.331, 0.387] | 3.4x10-274 |
| Blood assays | Mean platelet vol. | Non-British white | Full model (covariates and genotypes) | R2 | 0.364 | [0.336, 0.392] | 1.2x10-278 |
| Blood assays | Mean platelet vol. | South Asian | Covariate-only model | R2 | 0.003 | [-0.003, 0.008] | 5.0x10-02 |
| Blood assays | Mean platelet vol. | South Asian | Genotype-only model | R2 | 0.232 | [0.194, 0.269] | 5.4x10-84 |
| Blood assays | Mean platelet vol. | South Asian | Full model (covariates and genotypes) | R2 | 0.232 | [0.195, 0.270] | 4.5x10-84 |
| Blood assays | Mean platelet vol. | African | Covariate-only model | R2 | 0.001 | [-0.002, 0.004] | 3.3x10-01 |
| Blood assays | Mean platelet vol. | African | Genotype-only model | R2 | 0.109 | [0.076, 0.142] | 6.3x10⁻³¹ |
| Blood assays | Mean platelet vol. | African | Full model (covariates and genotypes) | R2 | 0.110 | [0.077, 0.143] | 5.1x10⁻³¹ |
| Blood assays | Mean platelet vol. | Others | Covariate-only model | R2 | 0.019 | [0.013, 0.025] | 2.3x10⁻³⁴ |
| Blood assays | Mean platelet vol. | Others | Genotype-only model | R2 | 0.315 | [0.299, 0.332] | <1.0x10-300 |
| Blood assays | Mean platelet vol. | Others | Full model (covariates and genotypes) | R2 | 0.309 | [0.293, 0.326] | <1.0x10-300 |
| Blood assays | Platelet dist. width | white British | Covariate-only model | R2 | 0.022 | [0.019, 0.024] | 1.9x10-308 |
| Blood assays | Platelet dist. width | white British | Genotype-only model | R2 | 0.209 | [0.203, 0.214] | <1.0x10-300 |
| Blood assays | Platelet dist. width | white British | Full model (covariates and genotypes) | R2 | 0.231 | [0.226, 0.237] | <1.0x10-300 |
| Blood assays | Platelet dist. width | Non-British white | Covariate-only model | R2 | 0.010 | [0.003, 0.017] | 1.3x10-07 |
| Blood assays | Platelet dist. width | Non-British white | Genotype-only model | R2 | 0.199 | [0.173, 0.225] | 1.8x10-137 |
| Blood assays | Platelet dist. width | Non-British white | Full model (covariates and genotypes) | R2 | 0.208 | [0.182, 0.234] | 1.8x10-144 |
| Blood assays | Platelet dist. width | South Asian | Covariate-only model | R2 | 0.013 | [0.002, 0.025] | 1.2x10-05 |
| Blood assays | Platelet dist. width | South Asian | Genotype-only model | R2 | 0.166 | [0.132, 0.201] | 1.8x10-58 |
| Blood assays | Platelet dist. width | South Asian | Full model (covariates and genotypes) | R2 | 0.184 | [0.148, 0.219] | 4.9x10-65 |
| Blood assays | Platelet dist. width | African | Covariate-only model | R2 | 0.032 | [0.013, 0.052] | 8.2x10⁻¹⁰ |
| Blood assays | Platelet dist. width | African | Genotype-only model | R2 | 0.066 | [0.039, 0.093] | 7.8x10⁻¹⁹ |
| Blood assays | Platelet dist. width | African | Full model (covariates and genotypes) | R2 | 0.090 | [0.060, 0.121] | 1.7x10⁻²⁵ |
| Blood assays | Platelet dist. width | Others | Covariate-only model | R2 | 0.045 | [0.037, 0.054] | 3.4x10-80 |
| Blood assays | Platelet dist. width | Others | Genotype-only model | R2 | 0.198 | [0.182, 0.214] | <1.0x10-300 |
| Blood assays | Platelet dist. width | Others | Full model (covariates and genotypes) | R2 | 0.224 | [0.208, 0.240] | <1.0x10-300 |
| Blood assays | Lymphocyte count | white British | Covariate-only model | R2 | 0.006 | [0.004, 0.007] | 2.6x10-82 |
| Blood assays | Lymphocyte count | white British | Genotype-only model | R2 | 0.022 | [0.020, 0.024] | 1.9x10-308 |
| Blood assays | Lymphocyte count | white British | Full model (covariates and genotypes) | R2 | 0.027 | [0.025, 0.030] | <1.0x10-300 |
| Blood assays | Lymphocyte count | Non-British white | Covariate-only model | R2 | 0.007 | [0.001, 0.014] | 5.1x10-06 |
| Blood assays | Lymphocyte count | Non-British white | Genotype-only model | R2 | 0.027 | [0.015, 0.039] | 1.9x10⁻¹⁸ |
| Blood assays | Lymphocyte count | Non-British white | Full model (covariates and genotypes) | R2 | 0.034 | [0.021, 0.047] | 8.8x10⁻²³ |
| Blood assays | Lymphocyte count | South Asian | Covariate-only model | R2 | 0.020 | [0.006, 0.034] | 1.0x10-07 |
| Blood assays | Lymphocyte count | South Asian | Genotype-only model | R2 | 0.042 | [0.022, 0.062] | 4.1x10⁻¹⁵ |
| Blood assays | Lymphocyte count | South Asian | Full model (covariates and genotypes) | R2 | 0.059 | [0.036, 0.082] | 1.3x10⁻²⁰ |
| Blood assays | Lymphocyte count | African | Covariate-only model | R2 | 0.024 | [0.007, 0.040] | 1.7x10-07 |
| Blood assays | Lymphocyte count | African | Genotype-only model | R2 | 0.006 | [-0.003, 0.014] | 1.2x10-02 |
| Blood assays | Lymphocyte count | African | Full model (covariates and genotypes) | R2 | 0.019 | [0.004, 0.034] | 3.4x10-06 |
| Blood assays | Lymphocyte count | Others | Covariate-only model | R2 | 0.021 | [0.015, 0.027] | 3.2x10-37 |
| Blood assays | Lymphocyte count | Others | Genotype-only model | R2 | 0.029 | [0.022, 0.036] | 2.4x10-51 |
| Blood assays | Lymphocyte count | Others | Full model (covariates and genotypes) | R2 | 0.047 | [0.038, 0.056] | 9.4x10-83 |
| Blood assays | Monocyte count | white British | Covariate-only model | R2 | 0.042 | [0.039, 0.045] | <1.0x10-300 |
| Blood assays | Monocyte count | white British | Genotype-only model | R2 | 0.082 | [0.078, 0.086] | <1.0x10-300 |
| Blood assays | Monocyte count | white British | Full model (covariates and genotypes) | R2 | 0.124 | [0.120, 0.129] | <1.0x10-300 |
| Blood assays | Monocyte count | Non-British white | Covariate-only model | R2 | 0.057 | [0.040, 0.073] | 2.1x10-37 |
| Blood assays | Monocyte count | Non-British white | Genotype-only model | R2 | 0.090 | [0.070, 0.110] | 2.1x10-59 |
| Blood assays | Monocyte count | Non-British white | Full model (covariates and genotypes) | R2 | 0.145 | [0.121, 0.169] | 1.2x10-97 |
| Blood assays | Monocyte count | South Asian | Covariate-only model | R2 | 0.044 | [0.024, 0.065] | 8.6x10⁻¹⁶ |
| Blood assays | Monocyte count | South Asian | Genotype-only model | R2 | 0.070 | [0.045, 0.095] | 2.2x10⁻²⁴ |
| Blood assays | Monocyte count | South Asian | Full model (covariates and genotypes) | R2 | 0.113 | [0.082, 0.143] | 7.8x10-39 |
| Blood assays | Monocyte count | African | Covariate-only model | R2 | 0.005 | [-0.003, 0.013] | 1.3x10-02 |
| Blood assays | Monocyte count | African | Genotype-only model | R2 | 0.033 | [0.014, 0.053] | 3.9x10⁻¹⁰ |
| Blood assays | Monocyte count | African | Full model (covariates and genotypes) | R2 | 0.033 | [0.014, 0.053] | 4.2x10⁻¹⁰ |
| Blood assays | Monocyte count | Others | Covariate-only model | R2 | 0.043 | [0.034, 0.051] | 3.0x10-75 |
| Blood assays | Monocyte count | Others | Genotype-only model | R2 | 0.079 | [0.068, 0.091] | 6.1x10-141 |
| Blood assays | Monocyte count | Others | Full model (covariates and genotypes) | R2 | 0.111 | [0.098, 0.124] | 6.0x10-199 |
| Blood assays | Neutrophil count | white British | Covariate-only model | R2 | 0.019 | [0.017, 0.021] | 2.1x10-278 |
| Blood assays | Neutrophil count | white British | Genotype-only model | R2 | 0.090 | [0.086, 0.094] | <1.0x10-300 |
| Blood assays | Neutrophil count | white British | Full model (covariates and genotypes) | R2 | 0.109 | [0.104, 0.113] | <1.0x10-300 |
| Blood assays | Neutrophil count | Non-British white | Covariate-only model | R2 | 0.022 | [0.011, 0.032] | 4.9x10⁻¹⁵ |
| Blood assays | Neutrophil count | Non-British white | Genotype-only model | R2 | 0.093 | [0.072, 0.113] | 2.8x10-61 |
| Blood assays | Neutrophil count | Non-British white | Full model (covariates and genotypes) | R2 | 0.113 | [0.092, 0.135] | 2.5x10-75 |
| Blood assays | Neutrophil count | South Asian | Covariate-only model | R2 | 0.011 | [0.000, 0.021] | 8.4x10-05 |
| Blood assays | Neutrophil count | South Asian | Genotype-only model | R2 | 0.080 | [0.054, 0.106] | 1.0x10⁻²⁷ |
| Blood assays | Neutrophil count | South Asian | Full model (covariates and genotypes) | R2 | 0.089 | [0.061, 0.116] | 1.4x10⁻³⁰ |
| Blood assays | Neutrophil count | African | Covariate-only model | R2 | 0.016 | [0.002, 0.031] | 1.3x10-05 |
| Blood assays | Neutrophil count | African | Genotype-only model | R2 | 0.057 | [0.032, 0.082] | 2.4x10⁻¹⁶ |
| Blood assays | Neutrophil count | African | Full model (covariates and genotypes) | R2 | 0.070 | [0.042, 0.098] | 6.3x10⁻²⁰ |
| Blood assays | Neutrophil count | Others | Covariate-only model | R2 | 0.037 | [0.029, 0.045] | 1.2x10-64 |
| Blood assays | Neutrophil count | Others | Genotype-only model | R2 | 0.096 | [0.084, 0.109] | 2.9x10-172 |
| Blood assays | Neutrophil count | Others | Full model (covariates and genotypes) | R2 | 0.109 | [0.096, 0.122] | 6.0x10-196 |
| Blood assays | Eosinophil count | white British | Covariate-only model | R2 | 0.009 | [0.007, 0.010] | 9.8x10-129 |
| Blood assays | Eosinophil count | white British | Genotype-only model | R2 | 0.093 | [0.089, 0.097] | <1.0x10-300 |
| Blood assays | Eosinophil count | white British | Full model (covariates and genotypes) | R2 | 0.101 | [0.097, 0.106] | <1.0x10-300 |
| Blood assays | Eosinophil count | Non-British white | Covariate-only model | R2 | 0.013 | [0.005, 0.021] | 2.4x10-09 |
| Blood assays | Eosinophil count | Non-British white | Genotype-only model | R2 | 0.072 | [0.054, 0.090] | 1.8x10-47 |
| Blood assays | Eosinophil count | Non-British white | Full model (covariates and genotypes) | R2 | 0.084 | [0.065, 0.104] | 1.4x10-55 |
| Blood assays | Eosinophil count | South Asian | Covariate-only model | R2 | 0.005 | [-0.002, 0.013] | 5.8x10-03 |
| Blood assays | Eosinophil count | South Asian | Genotype-only model | R2 | 0.048 | [0.027, 0.069] | 5.6x10⁻¹⁷ |
| Blood assays | Eosinophil count | South Asian | Full model (covariates and genotypes) | R2 | 0.053 | [0.031, 0.075] | 1.2x10⁻¹⁸ |
| Blood assays | Eosinophil count | African | Covariate-only model | R2 | 0.010 | [-0.001, 0.021] | 7.1x10-04 |
| Blood assays | Eosinophil count | African | Genotype-only model | R2 | 0.007 | [-0.002, 0.016] | 6.1x10-03 |
| Blood assays | Eosinophil count | African | Full model (covariates and genotypes) | R2 | 0.013 | [0.000, 0.026] | 9.9x10-05 |
| Blood assays | Eosinophil count | Others | Covariate-only model | R2 | 0.028 | [0.021, 0.035] | 3.5x10-50 |
| Blood assays | Eosinophil count | Others | Genotype-only model | R2 | 0.069 | [0.058, 0.080] | 3.7x10-122 |
| Blood assays | Eosinophil count | Others | Full model (covariates and genotypes) | R2 | 0.093 | [0.081, 0.105] | 2.0x10-165 |
| Blood assays | Basophil count | white British | Covariate-only model | R2 | 0.004 | [0.003, 0.005] | 1.1x10-65 |
| Blood assays | Basophil count | white British | Genotype-only model | R2 | 0.015 | [0.013, 0.017] | 1.2x10-220 |
| Blood assays | Basophil count | white British | Full model (covariates and genotypes) | R2 | 0.019 | [0.017, 0.021] | 2.0x10-282 |
| Blood assays | Basophil count | Non-British white | Covariate-only model | R2 | 0.004 | [-0.001, 0.009] | 7.8x10-04 |
| Blood assays | Basophil count | Non-British white | Genotype-only model | R2 | 0.018 | [0.009, 0.028] | 4.6x10⁻¹³ |
| Blood assays | Basophil count | Non-British white | Full model (covariates and genotypes) | R2 | 0.022 | [0.011, 0.032] | 4.5x10⁻¹⁵ |
| Blood assays | Basophil count | South Asian | Covariate-only model | R2 | 0.002 | [-0.002, 0.006] | 1.1x10-01 |
| Blood assays | Basophil count | South Asian | Genotype-only model | R2 | 0.006 | [-0.002, 0.013] | 5.0x10-03 |
| Blood assays | Basophil count | South Asian | Full model (covariates and genotypes) | R2 | 0.007 | [-0.001, 0.015] | 1.8x10-03 |
| Blood assays | Basophil count | African | Covariate-only model | R2 | 0.005 | [-0.003, 0.013] | 1.3x10-02 |
| Blood assays | Basophil count | African | Genotype-only model | R2 | 0.004 | [-0.003, 0.012] | 2.3x10-02 |
| Blood assays | Basophil count | African | Full model (covariates and genotypes) | R2 | 0.010 | [-0.001, 0.021] | 7.6x10-04 |
| Blood assays | Basophil count | Others | Covariate-only model | R2 | 0.009 | [0.005, 0.013] | 5.9x10⁻¹⁷ |
| Blood assays | Basophil count | Others | Genotype-only model | R2 | 0.014 | [0.009, 0.019] | 1.0x10⁻²⁴ |
| Blood assays | Basophil count | Others | Full model (covariates and genotypes) | R2 | 0.021 | [0.015, 0.028] | 4.7x10-38 |
| Blood assays | Lymphocyte % | white British | Covariate-only model | R2 | 0.033 | [0.031, 0.036] | <1.0x10-300 |
| Blood assays | Lymphocyte % | white British | Genotype-only model | R2 | 0.090 | [0.086, 0.094] | <1.0x10-300 |
| Blood assays | Lymphocyte % | white British | Full model (covariates and genotypes) | R2 | 0.123 | [0.119, 0.128] | <1.0x10-300 |
| Blood assays | Lymphocyte % | Non-British white | Covariate-only model | R2 | 0.029 | [0.017, 0.041] | 1.7x10⁻¹⁹ |
| Blood assays | Lymphocyte % | Non-British white | Genotype-only model | R2 | 0.082 | [0.063, 0.101] | 4.4x10-54 |
| Blood assays | Lymphocyte % | Non-British white | Full model (covariates and genotypes) | R2 | 0.112 | [0.090, 0.134] | 1.9x10-74 |
| Blood assays | Lymphocyte % | South Asian | Covariate-only model | R2 | 0.021 | [0.007, 0.036] | 3.4x10-08 |
| Blood assays | Lymphocyte % | South Asian | Genotype-only model | R2 | 0.054 | [0.031, 0.076] | 8.4x10⁻¹⁹ |
| Blood assays | Lymphocyte % | South Asian | Full model (covariates and genotypes) | R2 | 0.074 | [0.049, 0.100] | 1.2x10⁻²⁵ |
| Blood assays | Lymphocyte % | African | Covariate-only model | R2 | 0.026 | [0.008, 0.044] | 3.9x10-08 |
| Blood assays | Lymphocyte % | African | Genotype-only model | R2 | 0.047 | [0.024, 0.070] | 1.1x10⁻¹³ |
| Blood assays | Lymphocyte % | African | Full model (covariates and genotypes) | R2 | 0.069 | [0.041, 0.096] | 1.4x10⁻¹⁹ |
| Blood assays | Lymphocyte % | Others | Covariate-only model | R2 | 0.074 | [0.063, 0.085] | 6.9x10-131 |
| Blood assays | Lymphocyte % | Others | Genotype-only model | R2 | 0.111 | [0.098, 0.124] | 2.1x10-200 |
| Blood assays | Lymphocyte % | Others | Full model (covariates and genotypes) | R2 | 0.153 | [0.139, 0.168] | 1.1x10-281 |
| Blood assays | Monocyte % | white British | Covariate-only model | R2 | 0.043 | [0.040, 0.046] | <1.0x10-300 |
| Blood assays | Monocyte % | white British | Genotype-only model | R2 | 0.085 | [0.081, 0.090] | <1.0x10-300 |
| Blood assays | Monocyte % | white British | Full model (covariates and genotypes) | R2 | 0.128 | [0.123, 0.133] | <1.0x10-300 |
| Blood assays | Monocyte % | Non-British white | Covariate-only model | R2 | 0.040 | [0.026, 0.054] | 1.0x10⁻²⁶ |
| Blood assays | Monocyte % | Non-British white | Genotype-only model | R2 | 0.085 | [0.066, 0.105] | 1.7x10-56 |
| Blood assays | Monocyte % | Non-British white | Full model (covariates and genotypes) | R2 | 0.122 | [0.100, 0.145] | 1.6x10-81 |
| Blood assays | Monocyte % | South Asian | Covariate-only model | R2 | 0.083 | [0.056, 0.110] | 1.1x10⁻²⁸ |
| Blood assays | Monocyte % | South Asian | Genotype-only model | R2 | 0.071 | [0.046, 0.096] | 1.7x10⁻²⁴ |
| Blood assays | Monocyte % | South Asian | Full model (covariates and genotypes) | R2 | 0.152 | [0.119, 0.186] | 4.2x10-53 |
| Blood assays | Monocyte % | African | Covariate-only model | R2 | 0.016 | [0.002, 0.029] | 2.1x10-05 |
| Blood assays | Monocyte % | African | Genotype-only model | R2 | 0.018 | [0.003, 0.032] | 6.3x10-06 |
| Blood assays | Monocyte % | African | Full model (covariates and genotypes) | R2 | 0.034 | [0.014, 0.054] | 3.3x10⁻¹⁰ |
| Blood assays | Monocyte % | Others | Covariate-only model | R2 | 0.039 | [0.031, 0.048] | 2.7x10-69 |
| Blood assays | Monocyte % | Others | Genotype-only model | R2 | 0.056 | [0.046, 0.066] | 3.2x10-99 |
| Blood assays | Monocyte % | Others | Full model (covariates and genotypes) | R2 | 0.088 | [0.076, 0.100] | 2.7x10-157 |
| Blood assays | Neutrophil % | white British | Covariate-only model | R2 | 0.012 | [0.011, 0.014] | 1.1x10-179 |
| Blood assays | Neutrophil % | white British | Genotype-only model | R2 | 0.083 | [0.079, 0.087] | <1.0x10-300 |
| Blood assays | Neutrophil % | white British | Full model (covariates and genotypes) | R2 | 0.095 | [0.091, 0.099] | <1.0x10-300 |
| Blood assays | Neutrophil % | Non-British white | Covariate-only model | R2 | 0.008 | [0.002, 0.015] | 1.1x10-06 |
| Blood assays | Neutrophil % | Non-British white | Genotype-only model | R2 | 0.081 | [0.062, 0.100] | 1.8x10-53 |
| Blood assays | Neutrophil % | Non-British white | Full model (covariates and genotypes) | R2 | 0.090 | [0.070, 0.110] | 2.5x10-59 |
| Blood assays | Neutrophil % | South Asian | Covariate-only model | R2 | 0.012 | [0.001, 0.024] | 2.4x10-05 |
| Blood assays | Neutrophil % | South Asian | Genotype-only model | R2 | 0.047 | [0.026, 0.068] | 1.1x10⁻¹⁶ |
| Blood assays | Neutrophil % | South Asian | Full model (covariates and genotypes) | R2 | 0.060 | [0.037, 0.083] | 6.3x10⁻²¹ |
| Blood assays | Neutrophil % | African | Covariate-only model | R2 | 0.031 | [0.012, 0.050] | 2.2x10-09 |
| Blood assays | Neutrophil % | African | Genotype-only model | R2 | 0.043 | [0.020, 0.065] | 1.5x10⁻¹² |
| Blood assays | Neutrophil % | African | Full model (covariates and genotypes) | R2 | 0.067 | [0.040, 0.094] | 4.2x10⁻¹⁹ |
| Blood assays | Neutrophil % | Others | Covariate-only model | R2 | 0.055 | [0.045, 0.064] | 3.2x10-96 |
| Blood assays | Neutrophil % | Others | Genotype-only model | R2 | 0.093 | [0.081, 0.106] | 6.0x10-167 |
| Blood assays | Neutrophil % | Others | Full model (covariates and genotypes) | R2 | 0.121 | [0.108, 0.135] | 6.3x10-219 |
| Blood assays | Eosinophil % | white British | Covariate-only model | R2 | 0.008 | [0.007, 0.009] | 3.1x10-116 |
| Blood assays | Eosinophil % | white British | Genotype-only model | R2 | 0.095 | [0.090, 0.099] | <1.0x10-300 |
| Blood assays | Eosinophil % | white British | Full model (covariates and genotypes) | R2 | 0.102 | [0.098, 0.107] | <1.0x10-300 |
| Blood assays | Eosinophil % | Non-British white | Covariate-only model | R2 | 0.010 | [0.003, 0.018] | 7.4x10-08 |
| Blood assays | Eosinophil % | Non-British white | Genotype-only model | R2 | 0.059 | [0.042, 0.076] | 5.8x10-39 |
| Blood assays | Eosinophil % | Non-British white | Full model (covariates and genotypes) | R2 | 0.069 | [0.052, 0.087] | 7.9x10-46 |
| Blood assays | Eosinophil % | South Asian | Covariate-only model | R2 | 0.011 | [0.001, 0.022] | 5.5x10-05 |
| Blood assays | Eosinophil % | South Asian | Genotype-only model | R2 | 0.065 | [0.041, 0.090] | 9.1x10⁻²³ |
| Blood assays | Eosinophil % | South Asian | Full model (covariates and genotypes) | R2 | 0.076 | [0.050, 0.102] | 3.3x10⁻²⁶ |
| Blood assays | Eosinophil % | African | Covariate-only model | R2 | 0.020 | [0.005, 0.036] | 1.1x10-06 |
| Blood assays | Eosinophil % | African | Genotype-only model | R2 | 0.006 | [-0.003, 0.014] | 9.9x10-03 |
| Blood assays | Eosinophil % | African | Full model (covariates and genotypes) | R2 | 0.017 | [0.003, 0.031] | 9.2x10-06 |
| Blood assays | Eosinophil % | Others | Covariate-only model | R2 | 0.022 | [0.016, 0.028] | 2.1x10-39 |
| Blood assays | Eosinophil % | Others | Genotype-only model | R2 | 0.076 | [0.065, 0.087] | 1.3x10-134 |
| Blood assays | Eosinophil % | Others | Full model (covariates and genotypes) | R2 | 0.097 | [0.084, 0.109] | 7.1x10-173 |
| Blood assays | Basophil % | white British | Covariate-only model | R2 | 0.002 | [0.002, 0.003] | 2.0x10⁻³⁴ |
| Blood assays | Basophil % | white British | Genotype-only model | R2 | 0.016 | [0.014, 0.018] | 5.2x10-229 |
| Blood assays | Basophil % | white British | Full model (covariates and genotypes) | R2 | 0.018 | [0.016, 0.020] | 9.2x10-258 |
| Blood assays | Basophil % | Non-British white | Covariate-only model | R2 | 0.004 | [-0.001, 0.008] | 1.1x10-03 |
| Blood assays | Basophil % | Non-British white | Genotype-only model | R2 | 0.018 | [0.008, 0.027] | 1.7x10⁻¹² |
| Blood assays | Basophil % | Non-British white | Full model (covariates and genotypes) | R2 | 0.021 | [0.011, 0.031] | 1.3x10⁻¹⁴ |
| Blood assays | Basophil % | South Asian | Covariate-only model | R2 | 0.000 | [-0.002, 0.002] | 4.4x10-01 |
| Blood assays | Basophil % | South Asian | Genotype-only model | R2 | 0.005 | [-0.002, 0.012] | 9.4x10-03 |
| Blood assays | Basophil % | South Asian | Full model (covariates and genotypes) | R2 | 0.005 | [-0.002, 0.012] | 1.0x10-02 |
| Blood assays | Basophil % | African | Covariate-only model | R2 | 0.002 | [-0.003, 0.008] | 9.2x10-02 |
| Blood assays | Basophil % | African | Genotype-only model | R2 | 0.002 | [-0.003, 0.007] | 1.3x10-01 |
| Blood assays | Basophil % | African | Full model (covariates and genotypes) | R2 | 0.004 | [-0.003, 0.012] | 2.5x10-02 |
| Blood assays | Basophil % | Others | Covariate-only model | R2 | 0.011 | [0.007, 0.016] | 9.3x10⁻²¹ |
| Blood assays | Basophil % | Others | Genotype-only model | R2 | 0.012 | [0.008, 0.017] | 6.4x10⁻²³ |
| Blood assays | Basophil % | Others | Full model (covariates and genotypes) | R2 | 0.023 | [0.016, 0.029] | 7.6x10-41 |
| Blood assays | Reticulocyte % | white British | Covariate-only model | R2 | 0.002 | [0.001, 0.002] | 4.8x10⁻²³ |
| Blood assays | Reticulocyte % | white British | Genotype-only model | R2 | 0.028 | [0.026, 0.031] | <1.0x10-300 |
| Blood assays | Reticulocyte % | white British | Full model (covariates and genotypes) | R2 | 0.030 | [0.027, 0.032] | <1.0x10-300 |
| Blood assays | Reticulocyte % | Non-British white | Covariate-only model | R2 | 0.005 | [0.000, 0.011] | 1.1x10-04 |
| Blood assays | Reticulocyte % | Non-British white | Genotype-only model | R2 | 0.069 | [0.051, 0.086] | 1.2x10-44 |
| Blood assays | Reticulocyte % | Non-British white | Full model (covariates and genotypes) | R2 | 0.075 | [0.056, 0.093] | 1.4x10-48 |
| Blood assays | Reticulocyte % | South Asian | Covariate-only model | R2 | 0.010 | [0.000, 0.021] | 1.5x10-04 |
| Blood assays | Reticulocyte % | South Asian | Genotype-only model | R2 | 0.082 | [0.055, 0.109] | 1.1x10⁻²⁷ |
| Blood assays | Reticulocyte % | South Asian | Full model (covariates and genotypes) | R2 | 0.089 | [0.061, 0.117] | 5.5x10⁻³⁰ |
| Blood assays | Reticulocyte % | African | Covariate-only model | R2 | 0.000 | [-0.002, 0.003] | 4.7x10-01 |
| Blood assays | Reticulocyte % | African | Genotype-only model | R2 | 0.016 | [0.002, 0.030] | 2.4x10-05 |
| Blood assays | Reticulocyte % | African | Full model (covariates and genotypes) | R2 | 0.012 | [0.000, 0.025] | 1.8x10-04 |
| Blood assays | Reticulocyte % | Others | Covariate-only model | R2 | 0.007 | [0.003, 0.011] | 2.3x10⁻¹³ |
| Blood assays | Reticulocyte % | Others | Genotype-only model | R2 | 0.036 | [0.028, 0.044] | 1.1x10-62 |
| Blood assays | Reticulocyte % | Others | Full model (covariates and genotypes) | R2 | 0.042 | [0.033, 0.050] | 8.9x10-72 |
| Blood assays | Reticulocyte count | white British | Covariate-only model | R2 | 0.013 | [0.011, 0.015] | 4.9x10-186 |
| Blood assays | Reticulocyte count | white British | Genotype-only model | R2 | 0.041 | [0.038, 0.044] | <1.0x10-300 |
| Blood assays | Reticulocyte count | white British | Full model (covariates and genotypes) | R2 | 0.054 | [0.050, 0.057] | <1.0x10-300 |
| Blood assays | Reticulocyte count | Non-British white | Covariate-only model | R2 | 0.029 | [0.017, 0.041] | 1.4x10⁻¹⁹ |
| Blood assays | Reticulocyte count | Non-British white | Genotype-only model | R2 | 0.071 | [0.053, 0.089] | 3.9x10-46 |
| Blood assays | Reticulocyte count | Non-British white | Full model (covariates and genotypes) | R2 | 0.101 | [0.081, 0.122] | 2.7x10-66 |
| Blood assays | Reticulocyte count | South Asian | Covariate-only model | R2 | 0.028 | [0.012, 0.045] | 2.8x10⁻¹⁰ |
| Blood assays | Reticulocyte count | South Asian | Genotype-only model | R2 | 0.071 | [0.046, 0.096] | 3.7x10⁻²⁴ |
| Blood assays | Reticulocyte count | South Asian | Full model (covariates and genotypes) | R2 | 0.097 | [0.069, 0.126] | 8.7x10⁻³³ |
| Blood assays | Reticulocyte count | African | Covariate-only model | R2 | 0.012 | [-0.000, 0.024] | 2.6x10-04 |
| Blood assays | Reticulocyte count | African | Genotype-only model | R2 | 0.015 | [0.001, 0.028] | 4.8x10-05 |
| Blood assays | Reticulocyte count | African | Full model (covariates and genotypes) | R2 | 0.027 | [0.009, 0.045] | 2.9x10-08 |
| Blood assays | Reticulocyte count | Others | Covariate-only model | R2 | 0.022 | [0.015, 0.028] | 6.9x10-38 |
| Blood assays | Reticulocyte count | Others | Genotype-only model | R2 | 0.036 | [0.028, 0.043] | 1.5x10-61 |
| Blood assays | Reticulocyte count | Others | Full model (covariates and genotypes) | R2 | 0.055 | [0.045, 0.064] | 1.6x10-94 |
| Blood assays | Mean reticulocyte vol. | white British | Covariate-only model | R2 | 0.016 | [0.014, 0.018] | 3.6x10-225 |
| Blood assays | Mean reticulocyte vol. | white British | Genotype-only model | R2 | 0.146 | [0.141, 0.151] | <1.0x10-300 |
| Blood assays | Mean reticulocyte vol. | white British | Full model (covariates and genotypes) | R2 | 0.161 | [0.156, 0.166] | <1.0x10-300 |
| Blood assays | Mean reticulocyte vol. | Non-British white | Covariate-only model | R2 | 0.029 | [0.017, 0.041] | 1.1x10⁻¹⁹ |
| Blood assays | Mean reticulocyte vol. | Non-British white | Genotype-only model | R2 | 0.144 | [0.120, 0.168] | 1.1x10-95 |
| Blood assays | Mean reticulocyte vol. | Non-British white | Full model (covariates and genotypes) | R2 | 0.172 | [0.147, 0.197] | 1.2x10-115 |
| Blood assays | Mean reticulocyte vol. | South Asian | Covariate-only model | R2 | 0.034 | [0.016, 0.052] | 4.5x10⁻¹² |
| Blood assays | Mean reticulocyte vol. | South Asian | Genotype-only model | R2 | 0.110 | [0.080, 0.140] | 3.5x10-37 |
| Blood assays | Mean reticulocyte vol. | South Asian | Full model (covariates and genotypes) | R2 | 0.138 | [0.105, 0.170] | 1.1x10-46 |
| Blood assays | Mean reticulocyte vol. | African | Covariate-only model | R2 | 0.006 | [-0.003, 0.014] | 1.1x10-02 |
| Blood assays | Mean reticulocyte vol. | African | Genotype-only model | R2 | 0.033 | [0.014, 0.053] | 6.4x10⁻¹⁰ |
| Blood assays | Mean reticulocyte vol. | African | Full model (covariates and genotypes) | R2 | 0.039 | [0.018, 0.060] | 3.0x10⁻¹¹ |
| Blood assays | Mean reticulocyte vol. | Others | Covariate-only model | R2 | 0.036 | [0.028, 0.044] | 1.2x10-62 |
| Blood assays | Mean reticulocyte vol. | Others | Genotype-only model | R2 | 0.130 | [0.117, 0.144] | 2.7x10-232 |
| Blood assays | Mean reticulocyte vol. | Others | Full model (covariates and genotypes) | R2 | 0.155 | [0.141, 0.170] | 2.8x10-279 |
| Blood assays | Mean sphered cell vol. | white British | Covariate-only model | R2 | 0.012 | [0.011, 0.014] | 2.7x10-175 |
| Blood assays | Mean sphered cell vol. | white British | Genotype-only model | R2 | 0.153 | [0.148, 0.158] | <1.0x10-300 |
| Blood assays | Mean sphered cell vol. | white British | Full model (covariates and genotypes) | R2 | 0.164 | [0.159, 0.169] | <1.0x10-300 |
| Blood assays | Mean sphered cell vol. | Non-British white | Covariate-only model | R2 | 0.024 | [0.013, 0.035] | 2.1x10⁻¹⁶ |
| Blood assays | Mean sphered cell vol. | Non-British white | Genotype-only model | R2 | 0.155 | [0.131, 0.180] | 1.2x10-103 |
| Blood assays | Mean sphered cell vol. | Non-British white | Full model (covariates and genotypes) | R2 | 0.179 | [0.154, 0.204] | 1.8x10-120 |
| Blood assays | Mean sphered cell vol. | South Asian | Covariate-only model | R2 | 0.017 | [0.004, 0.030] | 1.2x10-06 |
| Blood assays | Mean sphered cell vol. | South Asian | Genotype-only model | R2 | 0.103 | [0.074, 0.132] | 1.2x10⁻³⁴ |
| Blood assays | Mean sphered cell vol. | South Asian | Full model (covariates and genotypes) | R2 | 0.116 | [0.086, 0.147] | 3.7x10-39 |
| Blood assays | Mean sphered cell vol. | African | Covariate-only model | R2 | 0.002 | [-0.003, 0.007] | 1.5x10-01 |
| Blood assays | Mean sphered cell vol. | African | Genotype-only model | R2 | 0.033 | [0.013, 0.052] | 9.4x10⁻¹⁰ |
| Blood assays | Mean sphered cell vol. | African | Full model (covariates and genotypes) | R2 | 0.034 | [0.014, 0.054] | 5.7x10⁻¹⁰ |
| Blood assays | Mean sphered cell vol. | Others | Covariate-only model | R2 | 0.039 | [0.030, 0.047] | 6.8x10-67 |
| Blood assays | Mean sphered cell vol. | Others | Genotype-only model | R2 | 0.137 | [0.123, 0.151] | 6.6x10-245 |
| Blood assays | Mean sphered cell vol. | Others | Full model (covariates and genotypes) | R2 | 0.164 | [0.149, 0.178] | 7.3x10-296 |
| Blood assays | Immature reticulocyte frac. | white British | Covariate-only model | R2 | 0.011 | [0.009, 0.013] | 1.6x10-157 |
| Blood assays | Immature reticulocyte frac. | white British | Genotype-only model | R2 | 0.093 | [0.089, 0.097] | <1.0x10-300 |
| Blood assays | Immature reticulocyte frac. | white British | Full model (covariates and genotypes) | R2 | 0.103 | [0.099, 0.108] | <1.0x10-300 |
| Blood assays | Immature reticulocyte frac. | Non-British white | Covariate-only model | R2 | 0.006 | [0.000, 0.012] | 4.6x10-05 |
| Blood assays | Immature reticulocyte frac. | Non-British white | Genotype-only model | R2 | 0.094 | [0.074, 0.114] | 2.4x10-61 |
| Blood assays | Immature reticulocyte frac. | Non-British white | Full model (covariates and genotypes) | R2 | 0.098 | [0.077, 0.119] | 5.9x10-64 |
| Blood assays | Immature reticulocyte frac. | South Asian | Covariate-only model | R2 | 0.010 | [0.000, 0.021] | 1.3x10-04 |
| Blood assays | Immature reticulocyte frac. | South Asian | Genotype-only model | R2 | 0.054 | [0.032, 0.076] | 1.4x10⁻¹⁸ |
| Blood assays | Immature reticulocyte frac. | South Asian | Full model (covariates and genotypes) | R2 | 0.061 | [0.037, 0.084] | 9.3x10⁻²¹ |
| Blood assays | Immature reticulocyte frac. | African | Covariate-only model | R2 | 0.007 | [-0.002, 0.016] | 4.8x10-03 |
| Blood assays | Immature reticulocyte frac. | African | Genotype-only model | R2 | 0.040 | [0.018, 0.061] | 1.7x10⁻¹¹ |
| Blood assays | Immature reticulocyte frac. | African | Full model (covariates and genotypes) | R2 | 0.048 | [0.024, 0.071] | 1.4x10⁻¹³ |
| Blood assays | Immature reticulocyte frac. | Others | Covariate-only model | R2 | 0.029 | [0.022, 0.036] | 6.4x10-50 |
| Blood assays | Immature reticulocyte frac. | Others | Genotype-only model | R2 | 0.082 | [0.070, 0.093] | 1.4x10-142 |
| Blood assays | Immature reticulocyte frac. | Others | Full model (covariates and genotypes) | R2 | 0.109 | [0.096, 0.122] | 4.8x10-192 |
| Blood assays | High light scatter reticulocyte % | white British | Covariate-only model | R2 | 0.001 | [0.001, 0.002] | 4.9x10⁻¹⁹ |
| Blood assays | High light scatter reticulocyte % | white British | Genotype-only model | R2 | 0.017 | [0.015, 0.019] | 4.0x10-246 |
| Blood assays | High light scatter reticulocyte % | white British | Full model (covariates and genotypes) | R2 | 0.018 | [0.016, 0.020] | 1.4x10-262 |
| Blood assays | High light scatter reticulocyte % | Non-British white | Covariate-only model | R2 | 0.006 | [0.000, 0.012] | 4.3x10-05 |
| Blood assays | High light scatter reticulocyte % | Non-British white | Genotype-only model | R2 | 0.099 | [0.078, 0.119] | 1.5x10-64 |
| Blood assays | High light scatter reticulocyte % | Non-British white | Full model (covariates and genotypes) | R2 | 0.105 | [0.083, 0.126] | 2.6x10-68 |
| Blood assays | High light scatter reticulocyte % | South Asian | Covariate-only model | R2 | 0.016 | [0.003, 0.029] | 2.0x10-06 |
| Blood assays | High light scatter reticulocyte % | South Asian | Genotype-only model | R2 | 0.088 | [0.060, 0.115] | 1.5x10⁻²⁹ |
| Blood assays | High light scatter reticulocyte % | South Asian | Full model (covariates and genotypes) | R2 | 0.097 | [0.069, 0.126] | 8.1x10⁻³³ |
| Blood assays | High light scatter reticulocyte % | African | Covariate-only model | R2 | 0.000 | [-0.002, 0.003] | 4.7x10-01 |
| Blood assays | High light scatter reticulocyte % | African | Genotype-only model | R2 | 0.031 | [0.012, 0.050] | 2.7x10-09 |
| Blood assays | High light scatter reticulocyte % | African | Full model (covariates and genotypes) | R2 | 0.030 | [0.011, 0.049] | 5.3x10-09 |
| Blood assays | High light scatter reticulocyte % | Others | Covariate-only model | R2 | 0.017 | [0.012, 0.023] | 1.6x10⁻³⁰ |
| Blood assays | High light scatter reticulocyte % | Others | Genotype-only model | R2 | 0.083 | [0.071, 0.094] | 1.7x10-144 |
| Blood assays | High light scatter reticulocyte % | Others | Full model (covariates and genotypes) | R2 | 0.095 | [0.083, 0.107] | 5.0x10-166 |
| Blood assays | High light scatter reticulocyte count | white British | Covariate-only model | R2 | 0.017 | [0.016, 0.019] | 3.9x10-250 |
| Blood assays | High light scatter reticulocyte count | white British | Genotype-only model | R2 | 0.113 | [0.109, 0.118] | <1.0x10-300 |
| Blood assays | High light scatter reticulocyte count | white British | Full model (covariates and genotypes) | R2 | 0.131 | [0.126, 0.135] | <1.0x10-300 |
| Blood assays | High light scatter reticulocyte count | Non-British white | Covariate-only model | R2 | 0.019 | [0.009, 0.029] | 4.0x10⁻¹³ |
| Blood assays | High light scatter reticulocyte count | Non-British white | Genotype-only model | R2 | 0.122 | [0.099, 0.144] | 4.5x10-80 |
| Blood assays | High light scatter reticulocyte count | Non-British white | Full model (covariates and genotypes) | R2 | 0.141 | [0.118, 0.165] | 1.7x10-93 |
| Blood assays | High light scatter reticulocyte count | South Asian | Covariate-only model | R2 | 0.026 | [0.010, 0.042] | 1.5x10-09 |
| Blood assays | High light scatter reticulocyte count | South Asian | Genotype-only model | R2 | 0.091 | [0.063, 0.119] | 1.2x10⁻³⁰ |
| Blood assays | High light scatter reticulocyte count | South Asian | Full model (covariates and genotypes) | R2 | 0.113 | [0.082, 0.143] | 6.1x10-38 |
| Blood assays | High light scatter reticulocyte count | African | Covariate-only model | R2 | 0.007 | [-0.002, 0.017] | 3.7x10-03 |
| Blood assays | High light scatter reticulocyte count | African | Genotype-only model | R2 | 0.040 | [0.019, 0.062] | 1.1x10⁻¹¹ |
| Blood assays | High light scatter reticulocyte count | African | Full model (covariates and genotypes) | R2 | 0.048 | [0.024, 0.071] | 1.3x10⁻¹³ |
| Blood assays | High light scatter reticulocyte count | Others | Covariate-only model | R2 | 0.040 | [0.031, 0.048] | 2.6x10-68 |
| Blood assays | High light scatter reticulocyte count | Others | Genotype-only model | R2 | 0.093 | [0.081, 0.106] | 1.6x10-163 |
| Blood assays | High light scatter reticulocyte count | Others | Full model (covariates and genotypes) | R2 | 0.125 | [0.111, 0.138] | 3.2x10-221 |
The predictive performance (R2), its 95% confidence interval (CI), and statistical significance (P-value) are shown for each population in UK Biobank in the held-out test set. The "model" column indicates whether the predictive performance is from the covariate-terms alone (covariate-only model), PGS terms alone (Genotype-only model), or the full model containing both PGS and covariate terms. We used the following sets of covariates in our analysis: age, sex, age2, age*sex, Townsend deprivation index, and genotype PCs (PC1-PC18). Please refer to our publication for a more detailed description of the methods.
References
-
Y. Tanigawa and M. Kellis. Power of inclusion: Enhancing polygenic prediction with admixed individuals. Am J Hum Genet. (2023).
- We introduce our inclusive PGS approach in this publication.
- Supplementary Data Files at figshare (doi: 10.6084/m9.figshare.22905368)
- MIT News article: Making genetic prediction models more inclusive
- Author interview: Inside AJHG: A Chat with Yosuke Tanigawa
-
J. Qian, Y. Tanigawa, W. Du, M. Aguirre, C. Chang, R. Tibshirani, M. A. Rivas, T. Hastie. A fast and scalable framework for large-scale and ultrahigh-dimensional sparse regression with application to the UK Biobank. PLoS Genet. 16, e1009141 (2020).
- In iPGS, we fit penalized multivariate regression on individual-level data using the BASIL algorithm implemented in the R snpnet package. This publication describes the BASIL algorithm and the R snpnet package.