Abstract
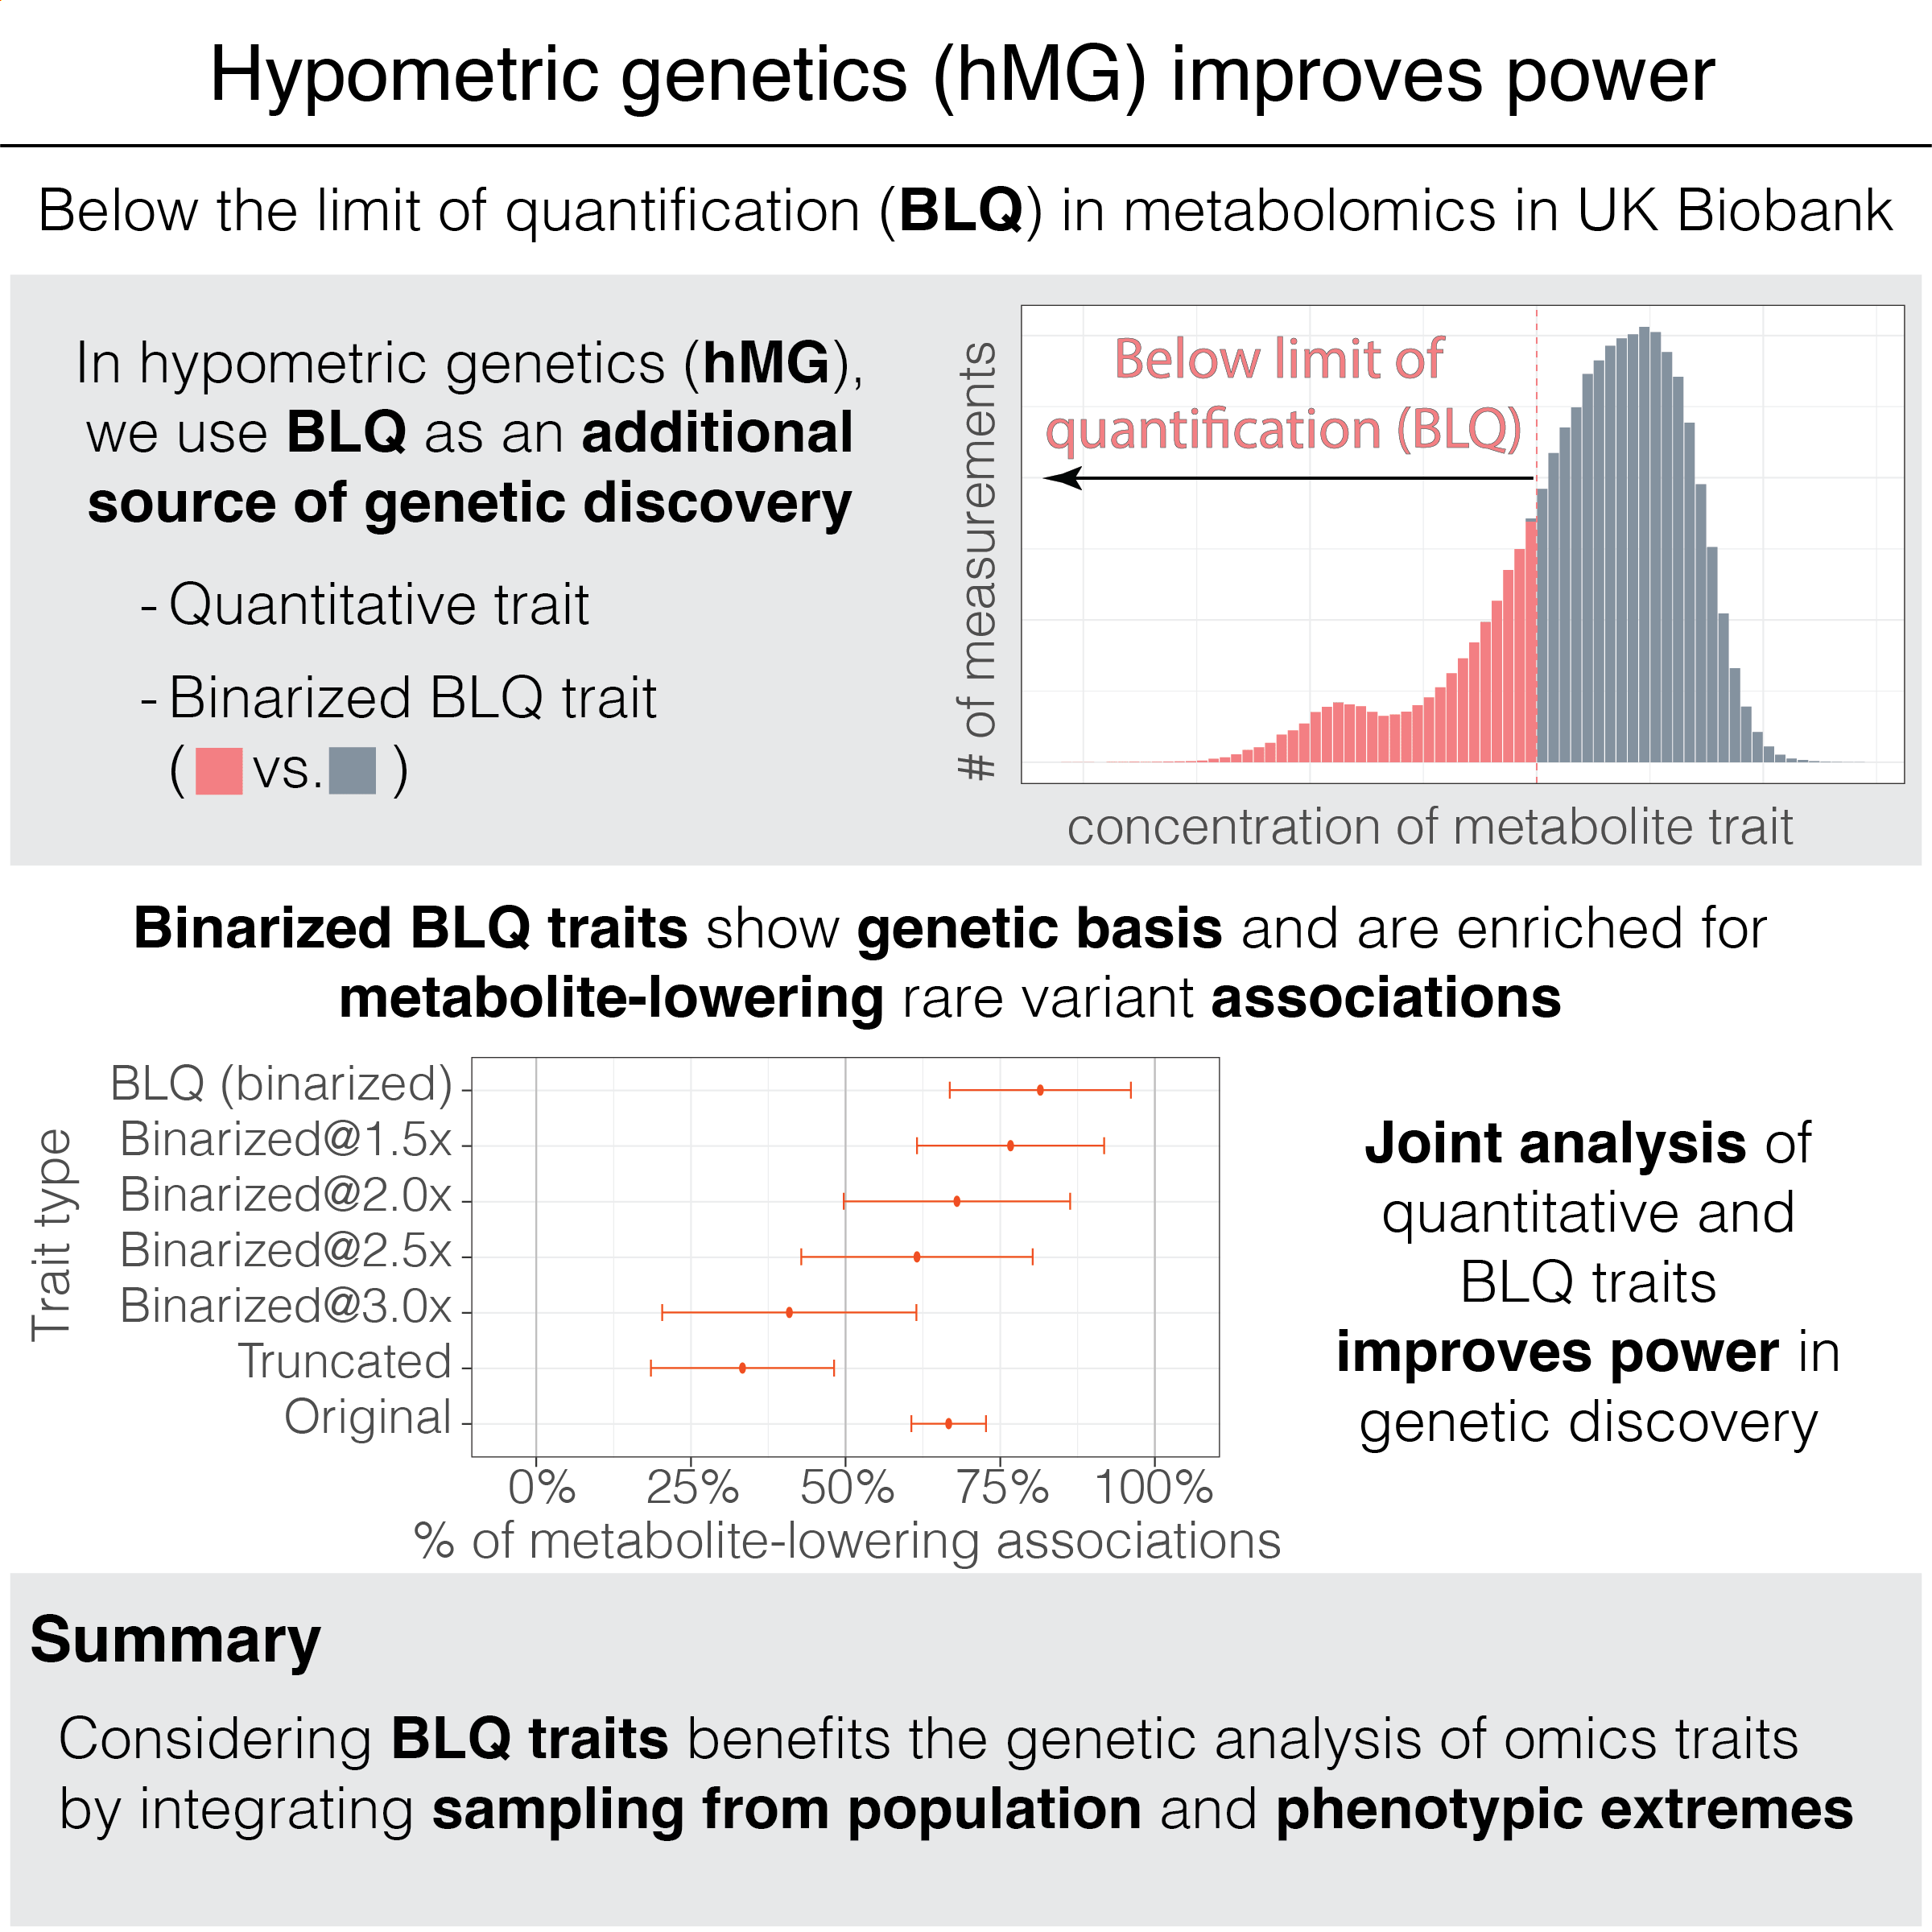
Balancing the tradeoff between quantity and quality of phenotypic data is critical in omics studies. Measurements below the limit of quantification (BLQ) are often tagged in quality control fields, but these flags are currently underutilized in human genetics studies. Extreme phenotype sampling is advantageous for mapping rare variant effects. We hypothesize that genetic drivers, along with environmental and technical factors, contribute to the presence of BLQ flags. Here, we introduce "hypometric genetics" (hMG) analysis and uncover a genetic basis for BLQ flags, indicating an additional source of genetic signal for genetic discovery, especially from phenotypic extremes. Applying our hMG approach to n=227,469 UK Biobank individuals with metabolomic profiles, we reveal more than 5% heritability for BLQ flags and report biologically relevant associations, for example, at APOC3, APOA5, and PDE3B loci. For common variants, polygenic scores trained only for BLQ flags predict the corresponding quantitative traits with 91% accuracy, validating the genetic basis. For rare coding variant associations, we find an asymmetric 65.4% higher enrichment of metabolite-lowering associations for BLQ flags, highlighting the impact of putative loss-of-function variants with large effects on phenotypic extremes. Joint analysis of binarized BLQ flags and the corresponding quantitative metabolite measurements improves power in Bayesian rare variant aggregation tests, resulting in an average of 181% more prioritized genes. Our approach is broadly applicable to -omics profiling. Overall, our results underscore the benefit of integrating quality control flags and quantitative measurements and highlight the advantage of joint analysis of population-based samples and phenotypic extremes in human genetics studies.
Browseable phenotypes
Here, we display available inclusive PGS models in UK Biobank. You can use the sorting and filtering functions. For example, you may enter ">30000" in the '# variants' column to select iPGS models with more than 30,000 genetic variants.
Predictive performance
You can also browse the predictive performance on the held-out test set in UK Biobank.
Data download
- For each phenotype listed above, you can download the coefficients of the iPGS models using the "download" button on each page.
- The coefficients of the PGS models analyzed in the study are available at the Open Science Framerowk (doi: 10.17605/OSF.IO/CEB7G), suitable for bulk downloading of the iPGS models across multiple traits.
References
-
Y. Tanigawa and M. Kellis. Hypometric genetics: improved power in genetic discovery by incorporating quality control flags. Am J Hum Genet. (2024).
- We introduce an application of the inclusive PGS approach to hypometric genetics (hMG) study.
- Supplementary Data Files at the Open Science Framerowk (doi: 10.17605/OSF.IO/CEB7G)
-
Y. Tanigawa and M. Kellis. Power of inclusion: Enhancing polygenic prediction with admixed individuals. Am J Hum Genet. (2024).
- We introduce our inclusive PGS approach in this publication.
- Supplementary Data Files at figshare (doi: 10.6084/m9.figshare.22905368)
- MIT News article: Making genetic prediction models more inclusive
- Author interview: Inside AJHG: A Chat with Yosuke Tanigawa
-
J. Qian, Y. Tanigawa, W. Du, M. Aguirre, C. Chang, R. Tibshirani, M. A. Rivas, T. Hastie. A fast and scalable framework for large-scale and ultrahigh-dimensional sparse regression with application to the UK Biobank. PLoS Genet. 16, e1009141 (2020).
- In iPGS, we fit penalized multivariate regression on individual-level data using the BASIL algorithm implemented in the R snpnet package. This publication describes the BASIL algorithm and the R snpnet package.

