Power of inclusion: Enhancing polygenic prediction with admixed individuals
Y. Tanigawa and M. Kellis. Am J Hum Genet. (2023).
Admixed individuals offer unique opportunities to address limited transferability in polygenic scores (PGS), given the substantial trans-ancestry genetic correlation in many complex traits. However, they are rarely considered in PGS training, given the challenges in representing ancestry-matched linkage-disequilibrium reference panels for admixed individuals. Here we present inclusive PGS (iPGS), which captures ancestry-shared genetic effects by finding the exact solution for penalized regression on individual-level data, thus naturally applicable to admixed individuals. We validate our approach in a simulation study across 33 configurations with varying heritability, polygenicity, and ancestry composition in the training set. Applying iPGS to n=237,055 ancestry-diverse individuals in UK Biobank, iPGS shows the greatest improvements in Africans by 48.9% on average across 60 quantitative traits and up to 50-fold for some traits (neutrophil count, R2=0.058) over the baseline model trained on the same number of European individuals. When allowing iPGS to use n=284,661 individuals, we observe an average improvement of 60.8% for African, 11.6% for South Asian, 7.3% for non-British white, 4.8% for white British, and 17.8% for the other individuals. We further develop iPGS+refit to jointly model the ancestry-shared and -dependent genetic effects when heterogeneous genetic associations are present. For neutrophil count, for example, iPGS+refit shows the highest predictive performance in the African (R2=0.115), which exceeds the best predictive performance for white British (R2=0.090 in the iPGS model), even though only 1.49% of individuals used in the iPGS training are of African ancestry. Our results indicate the power of diverse individuals to develop more equitable PGS models.
Inclusive PGS (iPGS) training with diverse ancestry enhances the transferability of polygenic scores in the UK Biobank

(A) Principal-component projection of the unrelated individuals in the UK Biobank and population assignment. (B) Relative average improvements of PGS model performance against the baseline model trained only with White British individuals. Error bars represent 95% confidence intervals of average improvements.
Browseable phenotypes
Here, we display available inclusive PGS models in UK Biobank. You can use the sorting and filtering functions. For example, you may enter ">30000" in the '# variants' column to select iPGS models with more than 30,000 genetic variants.
| Trait category | Trait | # variants | Heritability |
|---|---|---|---|
| Trait category | Trait | # variants | Heritability |
|
|
|||
| Anthropometry | Waist circumference | 31406 | 0.178 |
| Anthropometry | Hip circumference | 32756 | 0.189 |
| Anthropometry | Height | 62419 | 0.429 |
| Anthropometry | Sitting height | 44543 | 0.311 |
| Anthropometry | BMI | 35941 | 0.208 |
| Anthropometry | Weight | 38592 | 0.227 |
| Anthropometry | Body fat % | 34374 | 0.197 |
| Anthropometry | Whole body fat mass | 33555 | 0.200 |
| Anthropometry | Whole body fat-free mass | 42786 | 0.269 |
| Anthropometry | Whole body water mass | 43166 | 0.268 |
| Anthropometry | Basal metabolic rate | 46752 | 0.254 |
| Anthropometry | Impd. of whole body | 42265 | 0.237 |
| Anthropometry | Impd. of leg R | 38218 | 0.222 |
| Anthropometry | Impd. of leg L | 36063 | 0.222 |
| Anthropometry | Impd. of arm R | 35455 | 0.207 |
| Anthropometry | Impd. of arm L | 36052 | 0.211 |
| Anthropometry | Leg fat % R | 32758 | 0.197 |
| Anthropometry | Leg fat mass R | 30780 | 0.185 |
| Anthropometry | Leg fat-free mass R | 38493 | 0.237 |
| Anthropometry | Leg fat % L | 33293 | 0.197 |
| Anthropometry | Leg fat mass L | 30794 | 0.185 |
| Anthropometry | Leg fat-free mass L | 38764 | 0.235 |
| Anthropometry | Arm fat % R | 32448 | 0.187 |
| Anthropometry | Arm fat mass R | 29790 | 0.178 |
| Anthropometry | Arm fat-free mass R | 38650 | 0.235 |
| Anthropometry | Arm fat % L | 32450 | 0.191 |
| Anthropometry | Arm fat mass L | 29392 | 0.176 |
| Anthropometry | Arm fat-free mass L | 39276 | 0.234 |
| Anthropometry | Trunk fat % | 32770 | 0.187 |
| Anthropometry | Trunk fat mass | 34357 | 0.203 |
| Anthropometry | Trunk fat-free mass | 42468 | 0.275 |
| Blood assays | Leukocyte count | 17890 | 0.117 |
| Blood assays | Erythrocyte count | 27293 | 0.190 |
| Blood assays | Hemoglobin conc. | 21078 | 0.146 |
| Blood assays | Hematocrit % | 20106 | 0.140 |
| Blood assays | Mean corpuscular vol. | 21818 | 0.178 |
| Blood assays | Mean corpuscular hemoglobin | 17127 | 0.149 |
| Blood assays | Mean corpuscular hemoglobin conc. | 4468 | 0.044 |
| Blood assays | Erythrocyte dist. width | 12557 | 0.121 |
| Blood assays | Platelet count | 32944 | 0.225 |
| Blood assays | Platelet crit | 27034 | 0.187 |
| Blood assays | Mean platelet vol. | 31032 | 0.236 |
| Blood assays | Platelet dist. width | 21899 | 0.171 |
| Blood assays | Lymphocyte count | 7291 | 0.052 |
| Blood assays | Monocyte count | 13415 | 0.098 |
| Blood assays | Neutrophil count | 18612 | 0.131 |
| Blood assays | Eosinophil count | 16859 | 0.139 |
| Blood assays | Basophil count | 4184 | 0.037 |
| Blood assays | Lymphocyte % | 20804 | 0.142 |
| Blood assays | Monocyte % | 10717 | 0.095 |
| Blood assays | Neutrophil % | 16931 | 0.130 |
| Blood assays | Eosinophil % | 17227 | 0.143 |
| Blood assays | Basophil % | 3472 | 0.034 |
| Blood assays | Reticulocyte % | 7884 | 0.062 |
| Blood assays | Reticulocyte count | 9558 | 0.072 |
| Blood assays | Mean reticulocyte vol. | 18832 | 0.156 |
| Blood assays | Mean sphered cell vol. | 21558 | 0.166 |
| Blood assays | Immature reticulocyte frac. | 16307 | 0.124 |
| Blood assays | High light scatter reticulocyte % | 11641 | 0.068 |
| Blood assays | High light scatter reticulocyte count | 19565 | 0.154 |
Predictive performance
You can also browse the predictive performance on the held-out test set in UK Biobank.
Systematic predictive performance evaluation of inclusive PGS (iPGS) models and PRS-CSx across 60 anthropometric and hematological traits in the UK Biobank
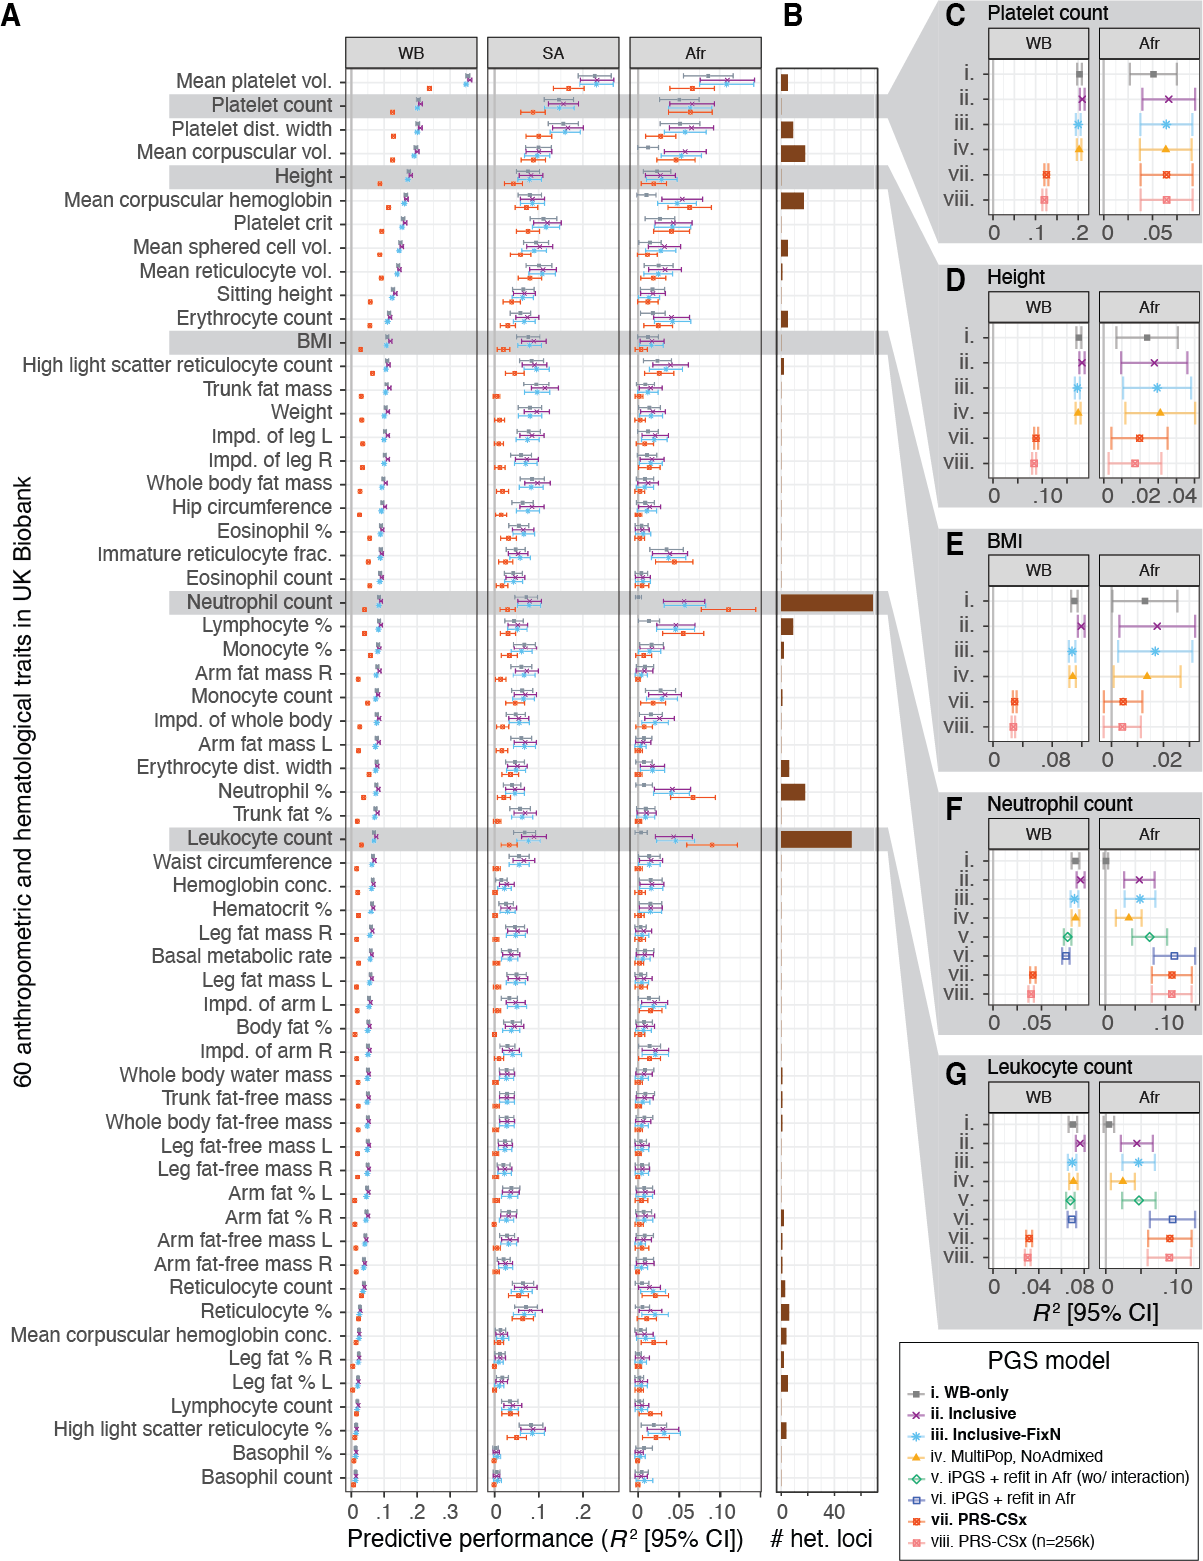
(A) The predictive performance (R2) in White British (WB), South Asian (SA), and African (Afr) groups in the UK Biobank are shown for four select models: (i) WB-only, (ii) inclusive, (iii) inclusive-FixN, and (vii) PRS-CSx. (B) The number of approximately LD-independent (R2 < 0.2 in the African population in the UK Biobank) variants with heterogeneous GWAS associations. (C–G). The predictive performance of up to eight PGS models in White British (WB) and African (Afr) populations in the UK Biobank are shown for five select traits. The refit models are trained only for the neutrophil and leukocyte counts, where genetic variants with heterogeneous GWAS effects were observed. The predictive performance for other models and ancestry groups is shown in Figures S4 and S5. BMI: body mass index. Vol.: volume. Dist.: distribution. Impd.: impedance. Frac.: fraction. Conc.: concentration. %: percentage. R: right. L: left. Error bars represent 95% confidence intervals.
Data download
- For each phenotype listed above, you can download the coefficients of the iPGS models using the "download" button on each page.
- The coefficients of the PGS models analyzed in the study are available as Supplementary Data Files at figshare (doi: 10.6084/m9.figshare.22905368), suitable for bulk downloading of the iPGS models across multiple traits.
- The iPGS models will also be available in the PGS catalog (PGP000502). Score IDs are listed in the S1 Table in Y. Tanigawa and M. Kellis. Am J Hum Genet. (2023).
References
-
Y. Tanigawa and M. Kellis. Power of inclusion: Enhancing polygenic prediction with admixed individuals. Am J Hum Genet. (2023).
- We introduce our inclusive PGS approach in this publication.
- Supplementary Data Files at figshare (doi: 10.6084/m9.figshare.22905368)
- MIT News article: Making genetic prediction models more inclusive
- Author interview: Inside AJHG: A Chat with Yosuke Tanigawa
-
J. Qian, Y. Tanigawa, W. Du, M. Aguirre, C. Chang, R. Tibshirani, M. A. Rivas, T. Hastie. A fast and scalable framework for large-scale and ultrahigh-dimensional sparse regression with application to the UK Biobank. PLoS Genet. 16, e1009141 (2020).
- In iPGS, we fit penalized multivariate regression on individual-level data using the BASIL algorithm implemented in the R snpnet package. This publication describes the BASIL algorithm and the R snpnet package.